
Interpreting data Math Worksheets for 8-Year-Olds
7 filtered results
Difficulty Level
Grade
Age
-
From - To
Subject
Activity
Standards
Explore our engaging and educational Interpreting Data Math Worksheets designed specifically for 8-year-olds! At Kids Academy, our worksheets help young learners build essential data interpretation skills in a fun and interactive way. Through various activities including bar graphs, pictographs, and tally charts, children will develop their ability to understand and analyze data visually. These worksheets are ideal for enhancing critical thinking, mathematical reasoning, and problem-solving abilities. Perfect for classroom use or at-home practice, our printable worksheets are a great resource for any young math enthusiast looking to grow their skills. Unlock your child's potential today!
Favorites
With answer key
Interactive
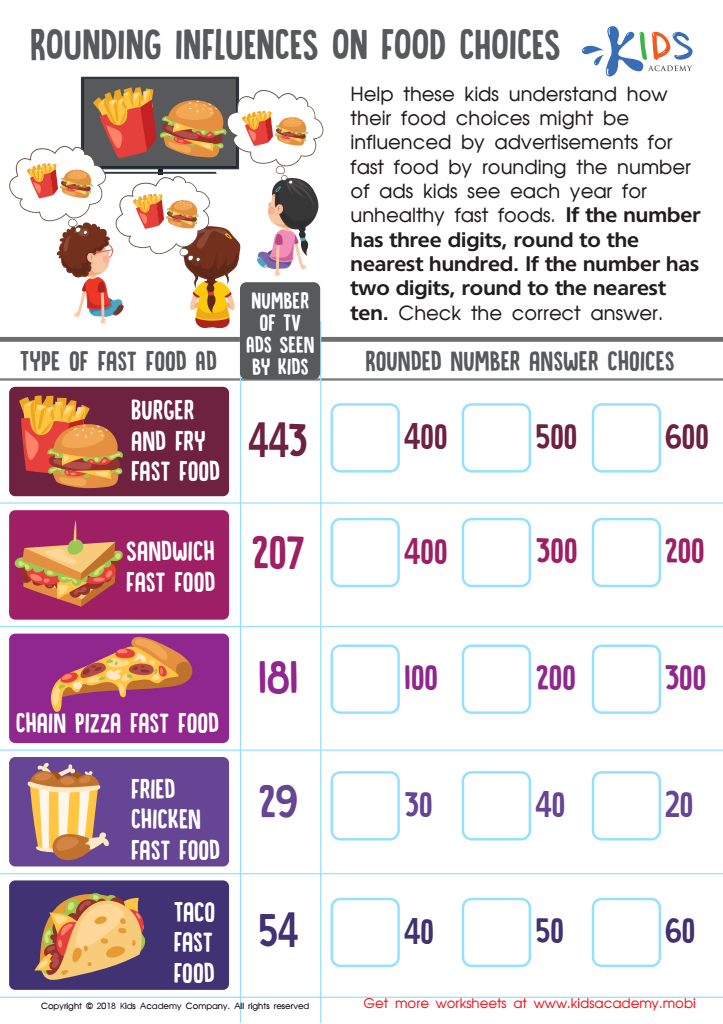
Rounding Influences Food Choices Worksheet
Kids find math more enjoyable when it reflects real-life scenarios. This free worksheet combines math and health! Kids view data on the number of ads they're exposed to in a year and must round the numbers to the nearest ten or hundred. Solve and check the correct answers to finish.
Rounding Influences Food Choices Worksheet
Worksheet

Interpret Line Plot Worksheet
Kids can learn to read graphs and analyze data easily with line plots. A fun zoo animal worksheet motivates kids to answer questions by reading the line plot and finding out how many animals a local zoo has.
Interpret Line Plot Worksheet
Worksheet

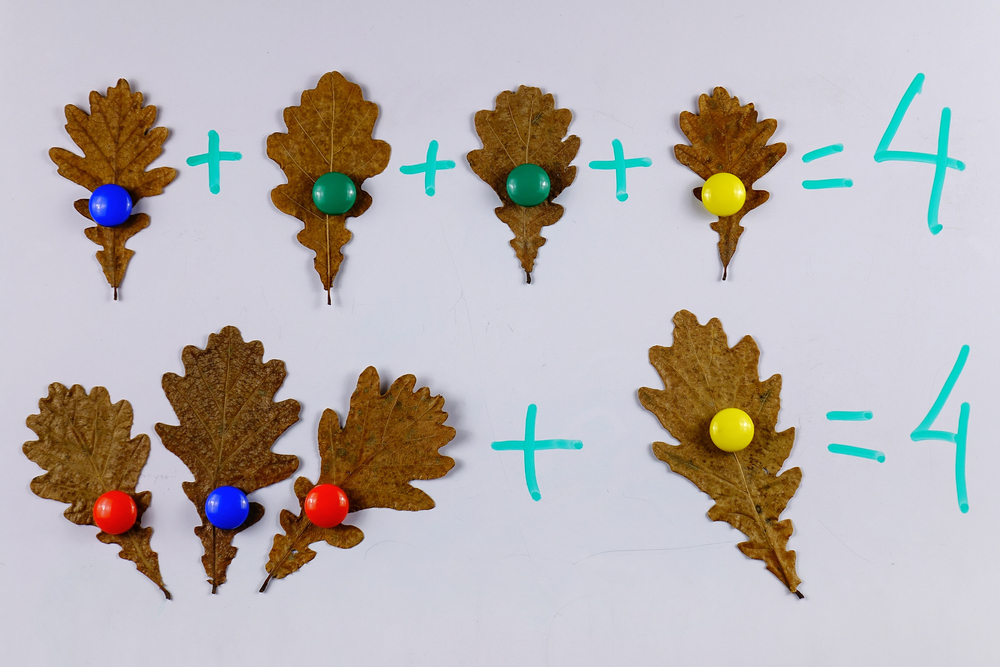
Leaf Bar Graph Worksheet
You can help your kids make learning easier and more enjoyable. While their teachers provide lessons and homework, you can take their education further. This worksheet can assist them in mastering bar charts. Count the leaves, then trace the correct line for each bar to complete the graph.
Leaf Bar Graph Worksheet
Worksheet
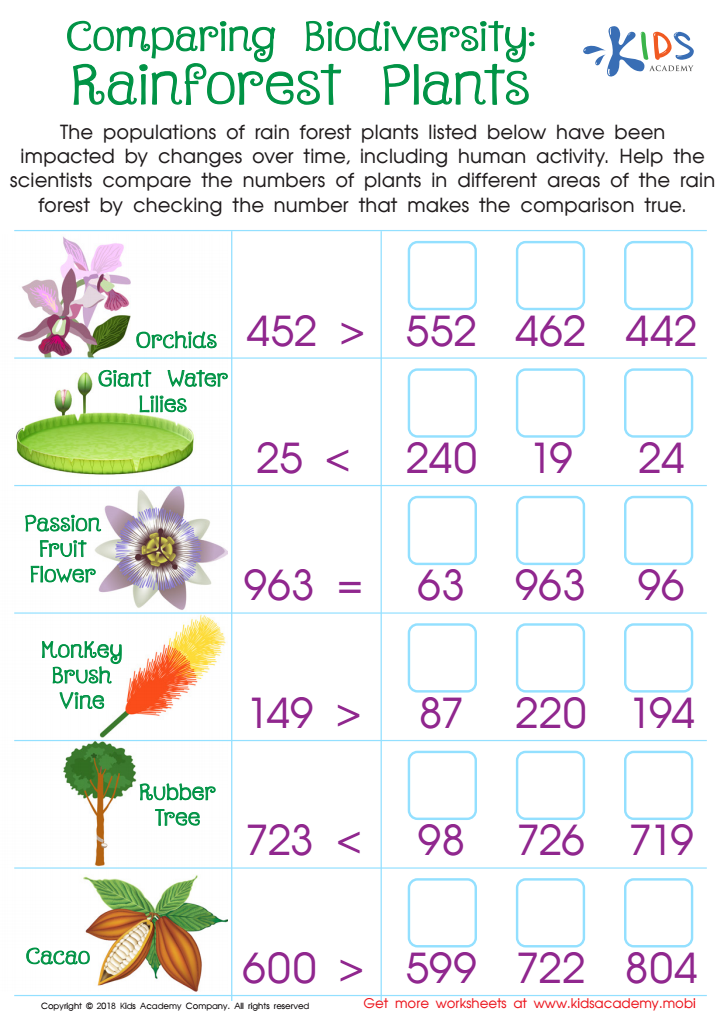
Comparing Biodiversity: Rainforest Plants Worksheet
Have your students learn about biodiversity in the rainforest and practice number sense and reasoning with this colorful PDF worksheet. Comparing the numbers of plants found in different areas of the rainforest, they'll combine eco-friendly science and math to make the number comparisons true.
Comparing Biodiversity: Rainforest Plants Worksheet
Worksheet
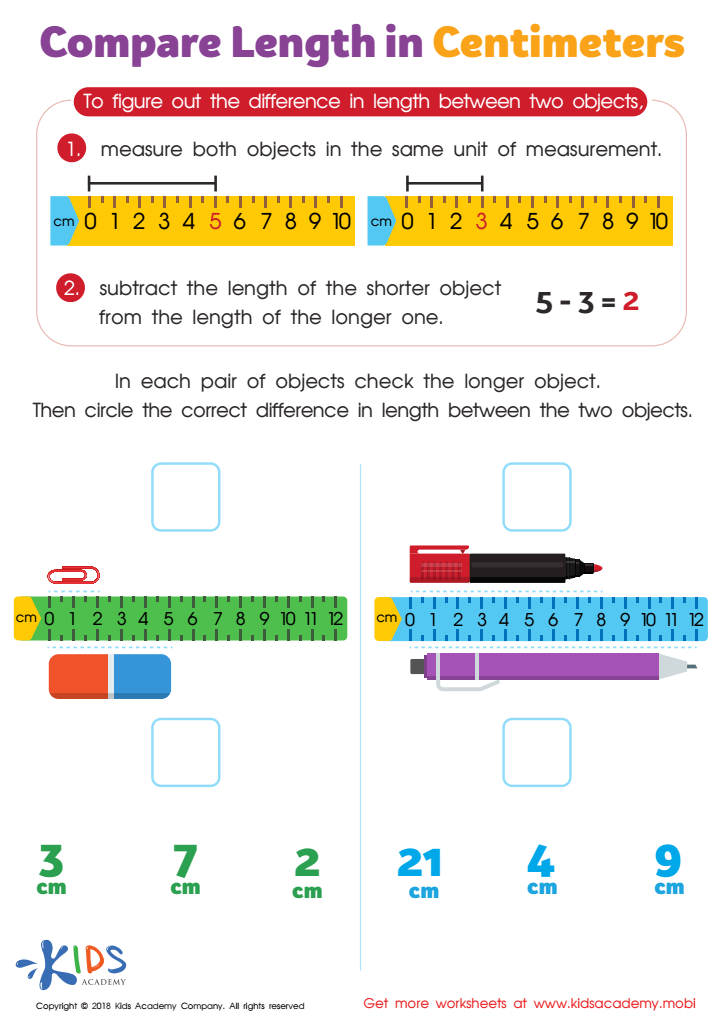
Compare Length in Centimeters Worksheet
To do this worksheet, your child needs to be able to measure accurately, add and subtract. They must measure both items and subtract the shorter from the longer to work out the difference in length.
Compare Length in Centimeters Worksheet
Worksheet

Pencil Case Line Plot Worksheet
Explain to your child that a line plot is a way to organize information. For example, if they need to arrange objects, they should draw a line plot. Now, have them help Tom measure the objects in his pencil case in inches. Then, have them check the line plot that accurately shows the length.
Pencil Case Line Plot Worksheet
Worksheet

Family Line Plot Worksheet
Have you and your kids ever done a family height measurement? How did it go? If they're familiar with it, this worksheet may be simpler. The picture shows a family with their heights recorded. Get your kid to look at the line plots and choose the one that shows the family's heights accurately.
Family Line Plot Worksheet
Worksheet
Join Kids Academy for Free
Who is primarily going to use this learning content?


Interpreting data is a crucial skill for 8-year-olds and it holds significant importance for both parents and teachers. At this developmental stage, children's brains are remarkably receptive to foundational concepts that will benefit them throughout their education and life. Teaching them to interpret data enhances their critical thinking, observation, and analytical skills, creating a solid foundation for more complex problem-solving tasks later on.
Interpreting data also introduces children to the concept of evidence-based decision-making. They learn to draw conclusions from sets of information, which fosters logical reasoning and reduces dependence on guesswork. This mathematical skill extends beyond the classroom, helping children in real-world tasks, such as understanding statistics in news stories, making sense of scores in their favorite sports, or even organizing their allowance.
Moreover, effective data interpretation helps in recognizing patterns, an essential aspect of mathematical learning and cognitive development. It promotes numeracy, which is as important as literacy in a child’s academic journey. For teachers, integrating data interpretation in lessons can lead to more interactive and engaging teaching methods, benefiting children who learn differently. For parents, these skills ensure that their children grow up to be informed individuals capable of navigating an increasingly data-driven world confidently. Therefore, investing time and effort in teaching children how to interpret data aligns with long-term educational goals and practical life skills.


