Data interpretation Easy Worksheets for Ages 7-9
10 filtered results
-
From - To
Explore our engaging Data Interpretation Easy Worksheets designed for children aged 7-9! These activities aim to build essential skills in analyzing and understanding data. Perfect for enhancing critical thinking, our worksheets feature fun graphics and age-appropriate exercises that encourage young learners to interpret charts, graphs, and tables. Tailored to align with educational standards, these resources make learning enjoyable while fostering foundational math concepts. Ideal for classroom use or homework, our worksheets help kids develop valuable analytical skills that will serve them throughout their academic journey. Dive into our collection today and watch your students gain confidence in data interpretation!

Fruit Math: Picture Graphs Worksheet

Students Line Plot Worksheet
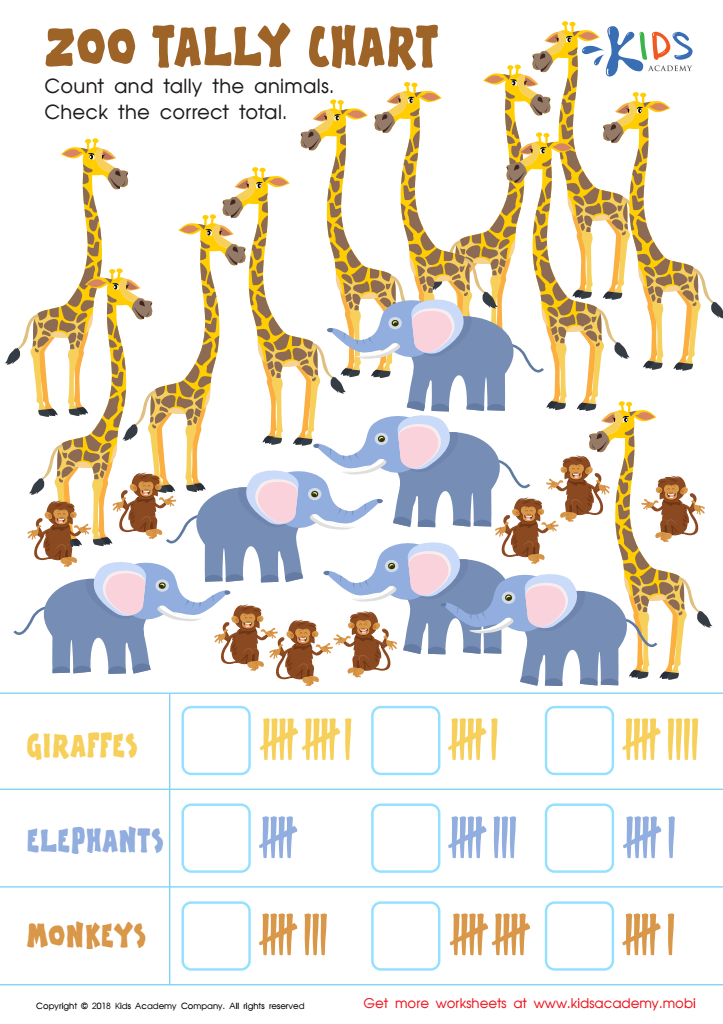
Zoo Tally Chart Worksheet
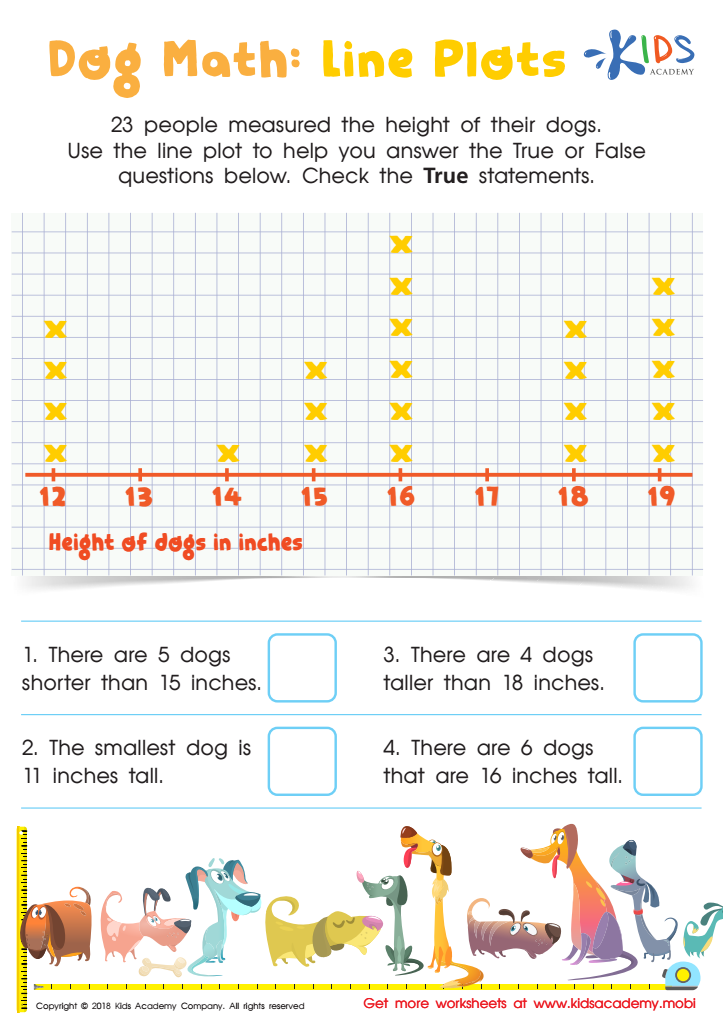
Dog Math: Line Plots Worksheet
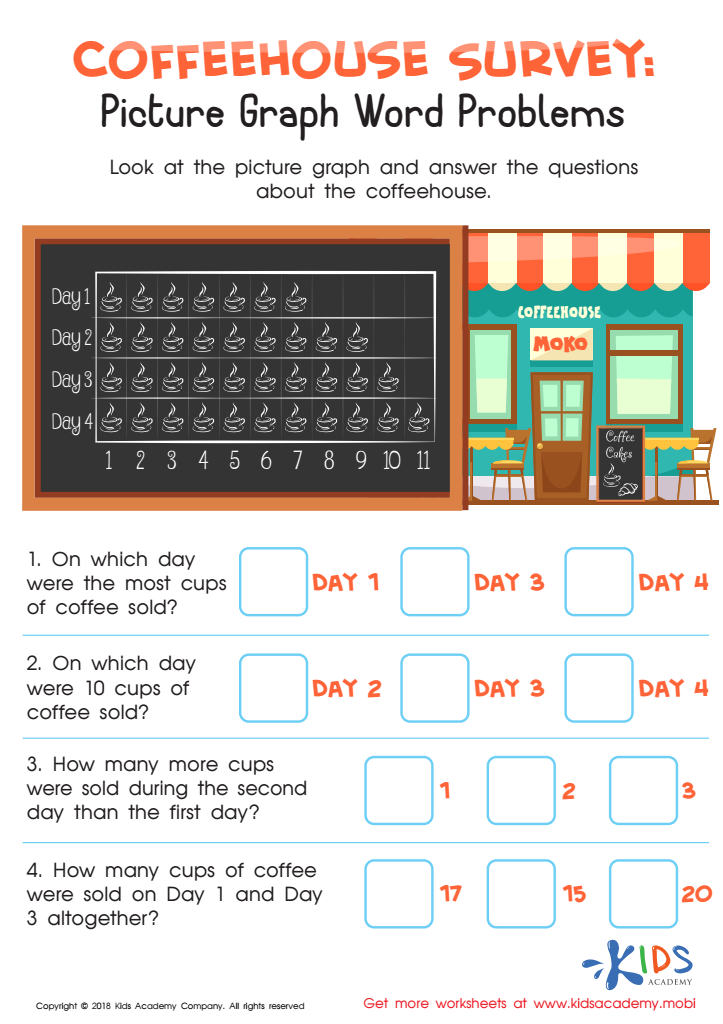
Coffeehouse Survey: Picture Graph Word Problems Worksheet
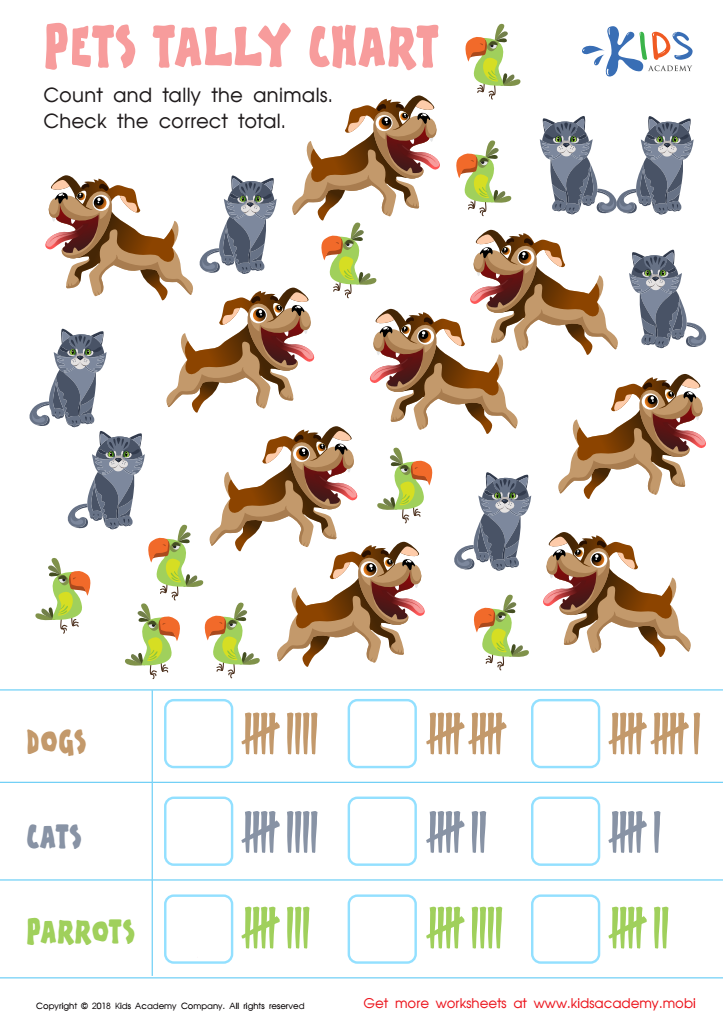
Pets Tally Chart Worksheet

Aircraft Carrier Picture Graphs Worksheet
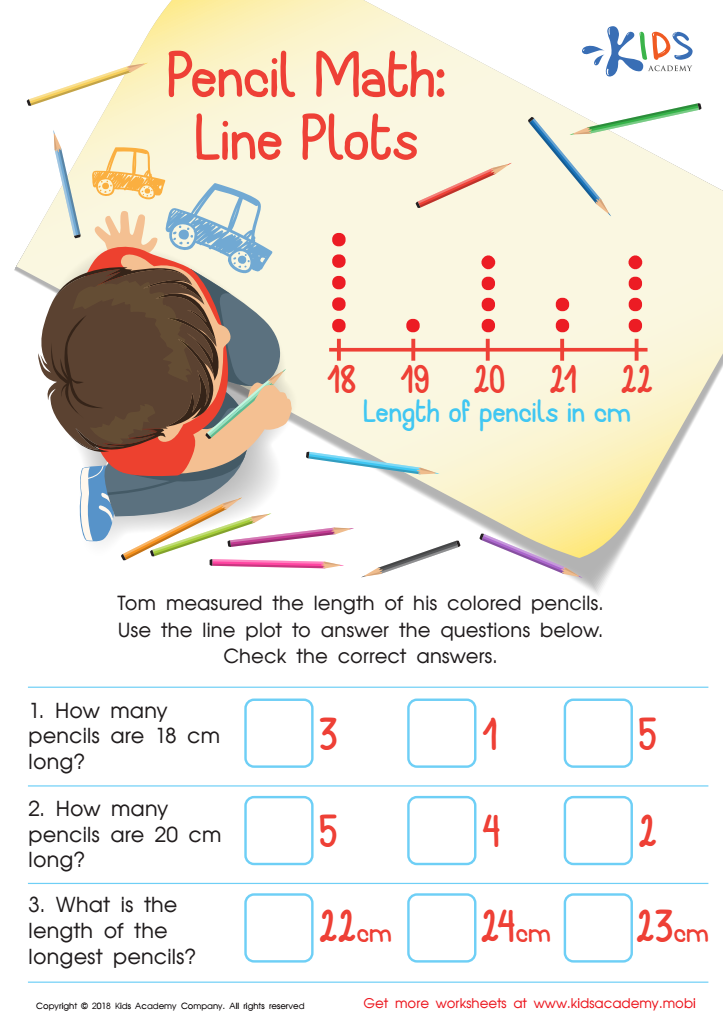
Pencil Math: Line Plots Worksheet
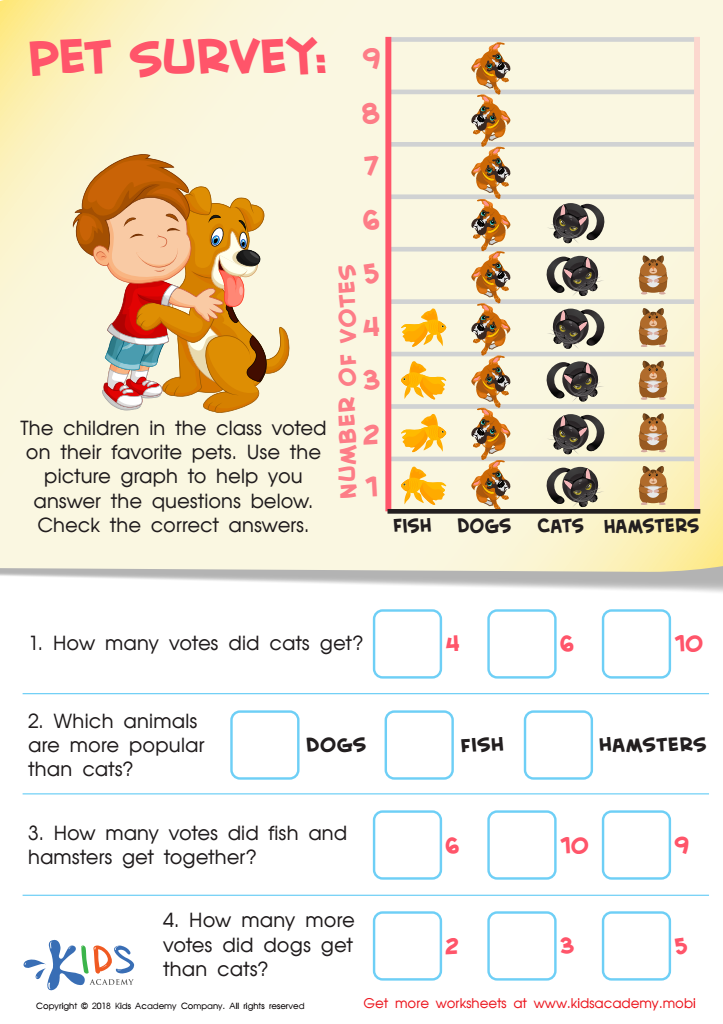
Pet Survey Worksheet
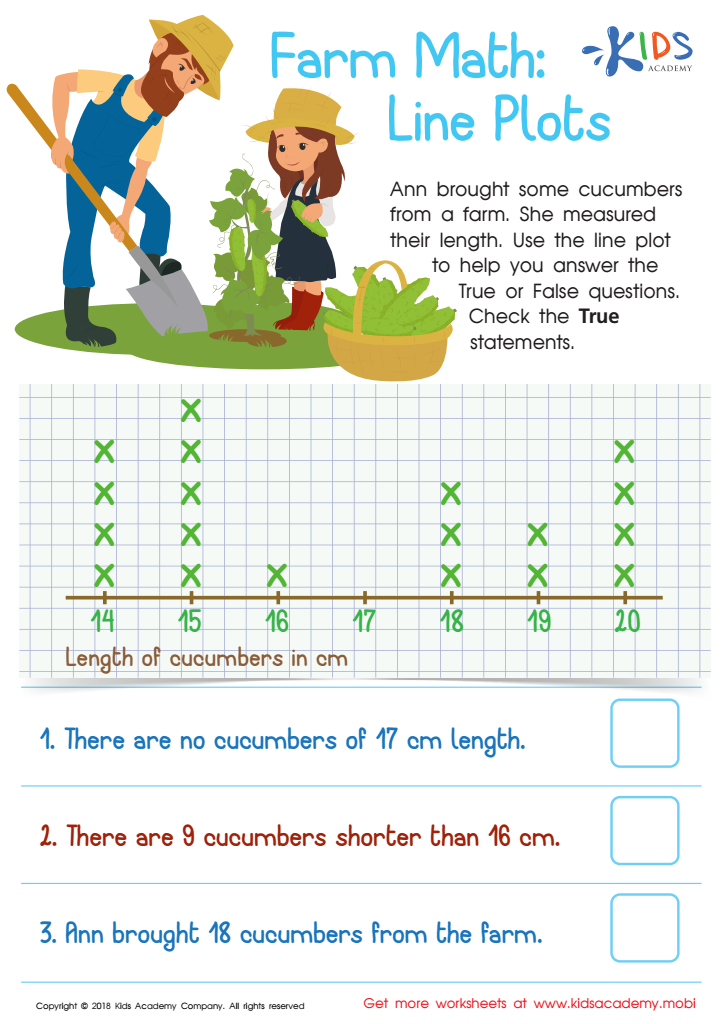
Farm Math: Line Plots Worksheet


.jpg)

Data interpretation is super important for kids aged 7-9 because it helps them understand the world around them. When parents and teachers emphasize data skills, they are giving children tools to analyze information effectively. This is essential in everyday life, from reading charts in a science class to understanding statistics in sports or weather reports.
By learning how to interpret data, kids develop critical thinking skills. They begin to ask questions like, "What does this number mean?" or "How does this trend change over time?" This curiosity fosters a love of learning.
Data interpretation also improves math skills. Children learn to read graphs and measurements, reinforcing their number skills and their ability to identify patterns. These skills are not only useful in school but also prepare them for future subjects involving math and science.
Moreover, understanding data is essential for good decision-making. For instance, by interpreting survey results from their class, students can see how their peers feel about a topic, helping them make informed choices on issues that matter to them.
Overall, teaching kids how to interpret data creates thoughtful, informed individuals ready to engage with their community and the world!