Data interpretation Easy Worksheets for 7-Year-Olds
9 filtered results
-
From - To
Discover our engaging "Data Interpretation Easy Worksheets" designed specifically for 7-year-olds! These fun, printable activities help young learners develop essential skills in understanding and interpreting data through charts, graphs, and simple statistics. Our worksheets make learning playful, encouraging kids to analyze information and draw conclusions confidently. With colorful visuals and interactive challenges, children will enjoy mastering concepts like bar graphs and pictograms. Perfect for homeschooling or classroom use, these resources support early math education while fostering critical thinking abilities. Help your child build a strong foundation in data interpretation with our thoughtfully crafted worksheets that make learning a delightful experience!

Fruit Math: Picture Graphs Worksheet

Students Line Plot Worksheet
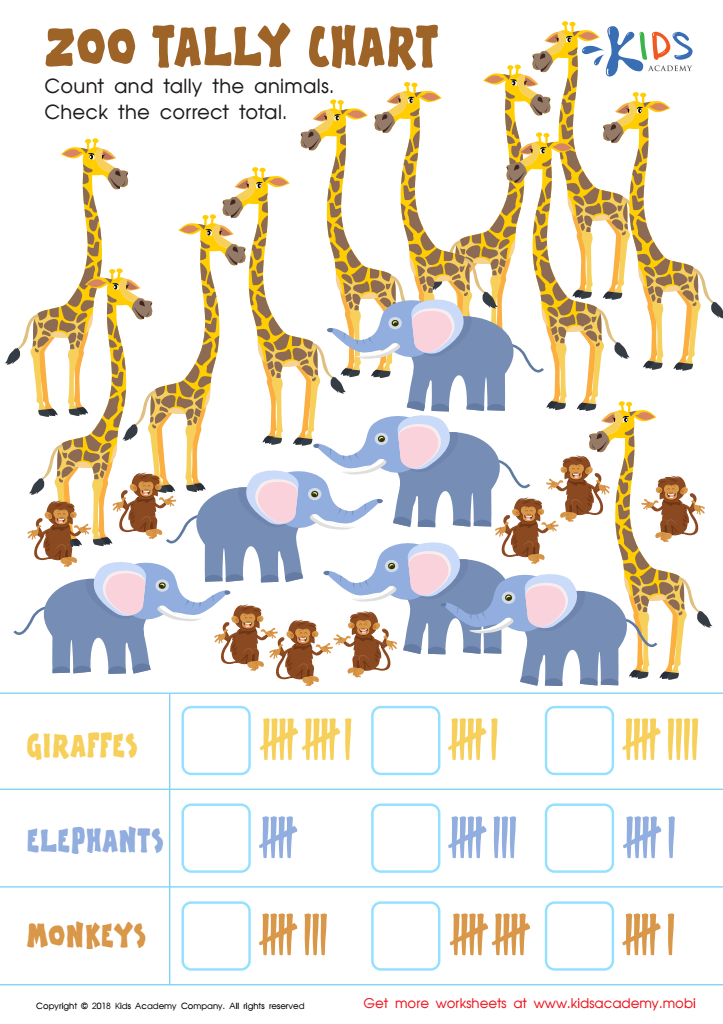
Zoo Tally Chart Worksheet
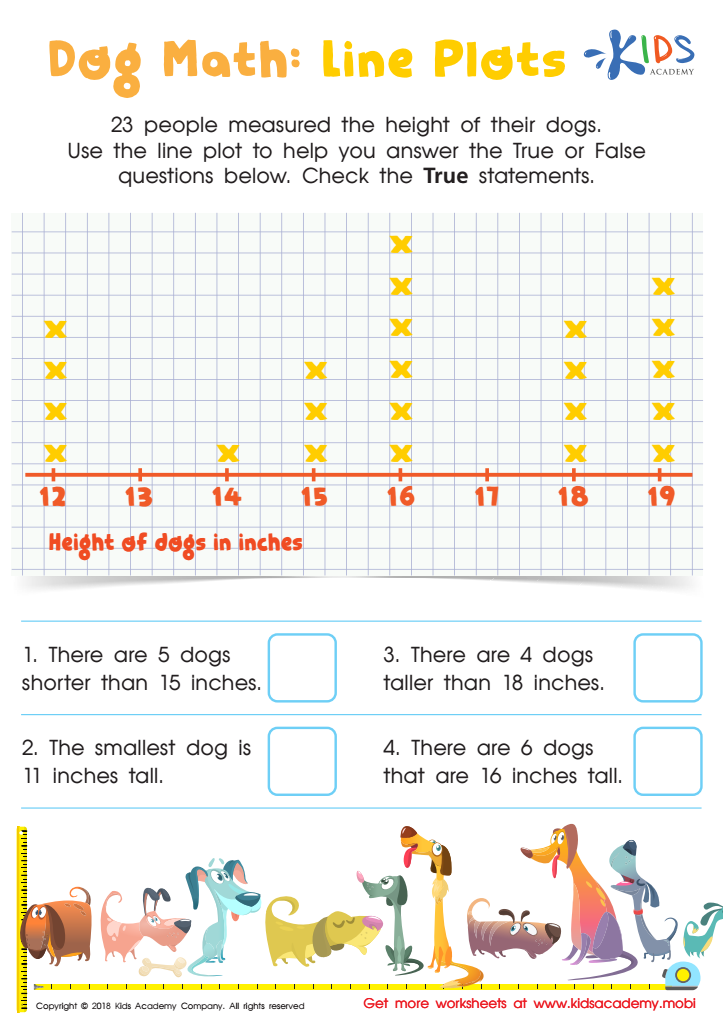
Dog Math: Line Plots Worksheet
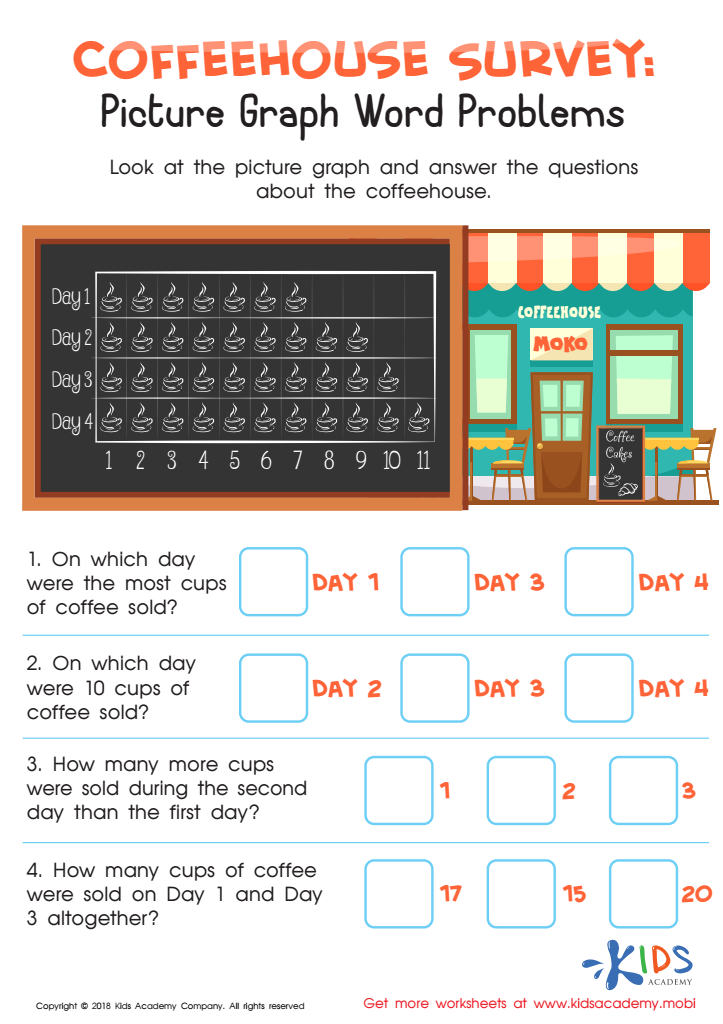
Coffeehouse Survey: Picture Graph Word Problems Worksheet
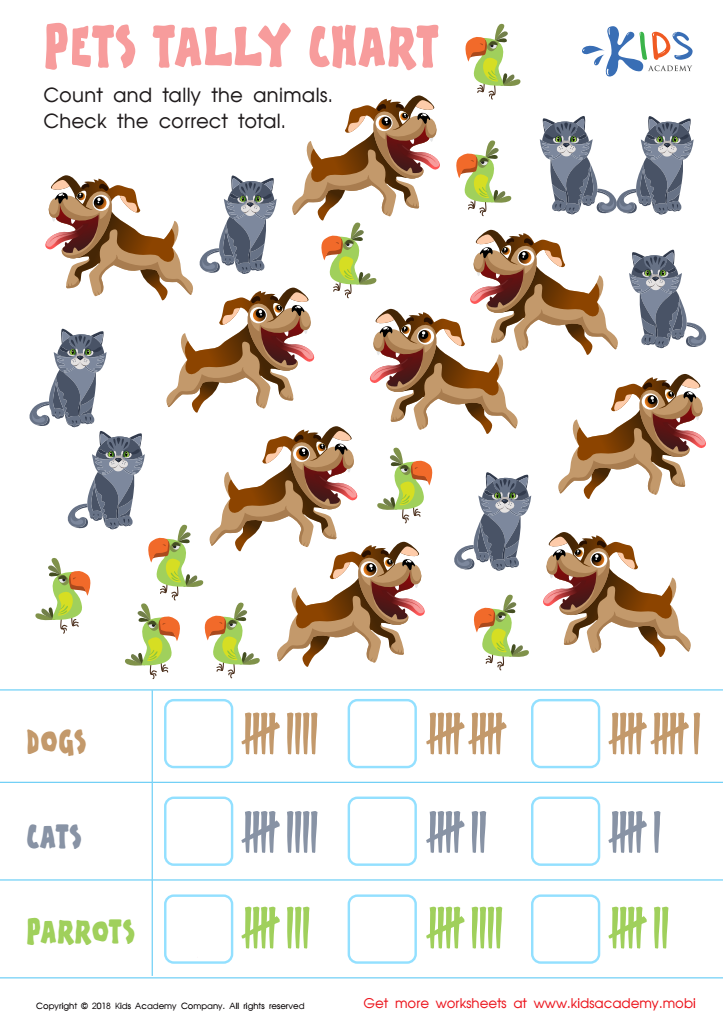
Pets Tally Chart Worksheet
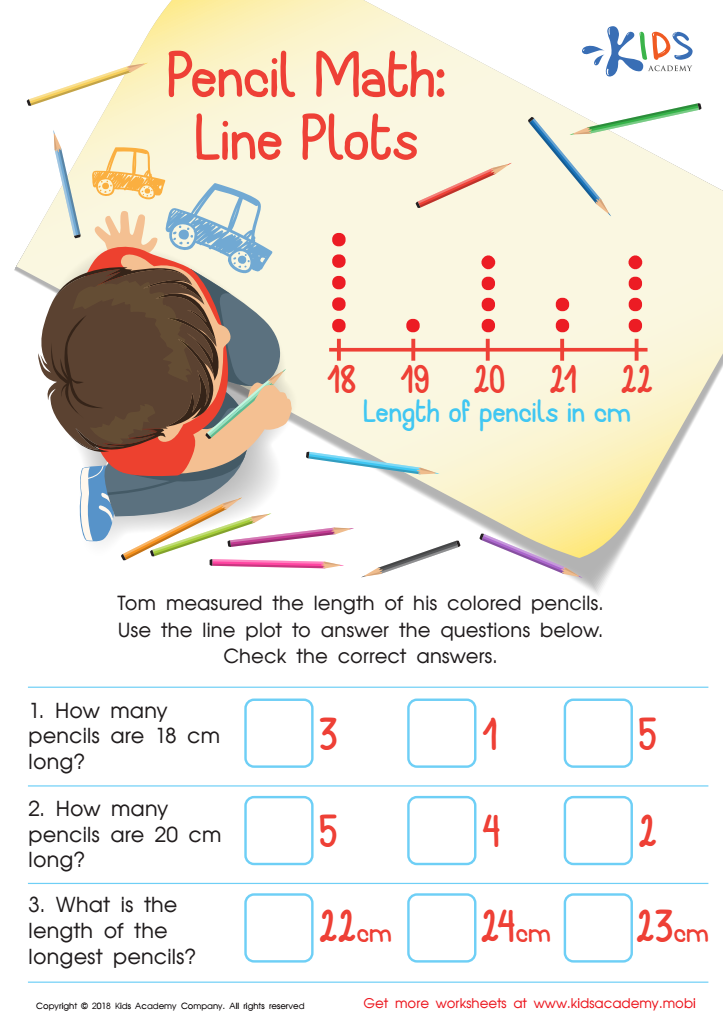
Pencil Math: Line Plots Worksheet
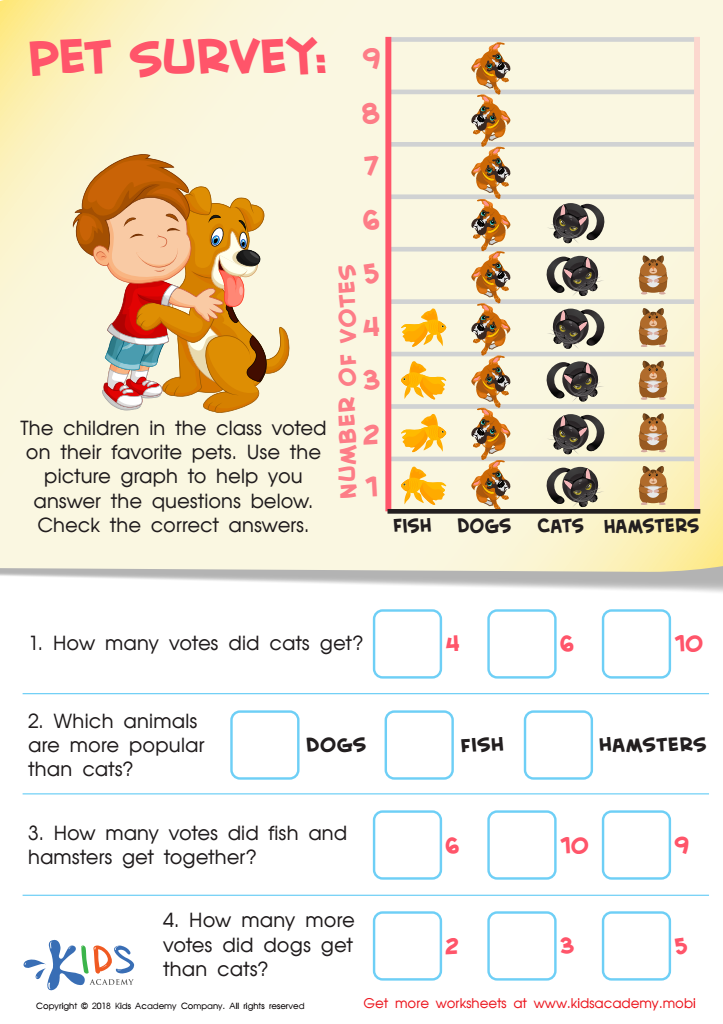
Pet Survey Worksheet
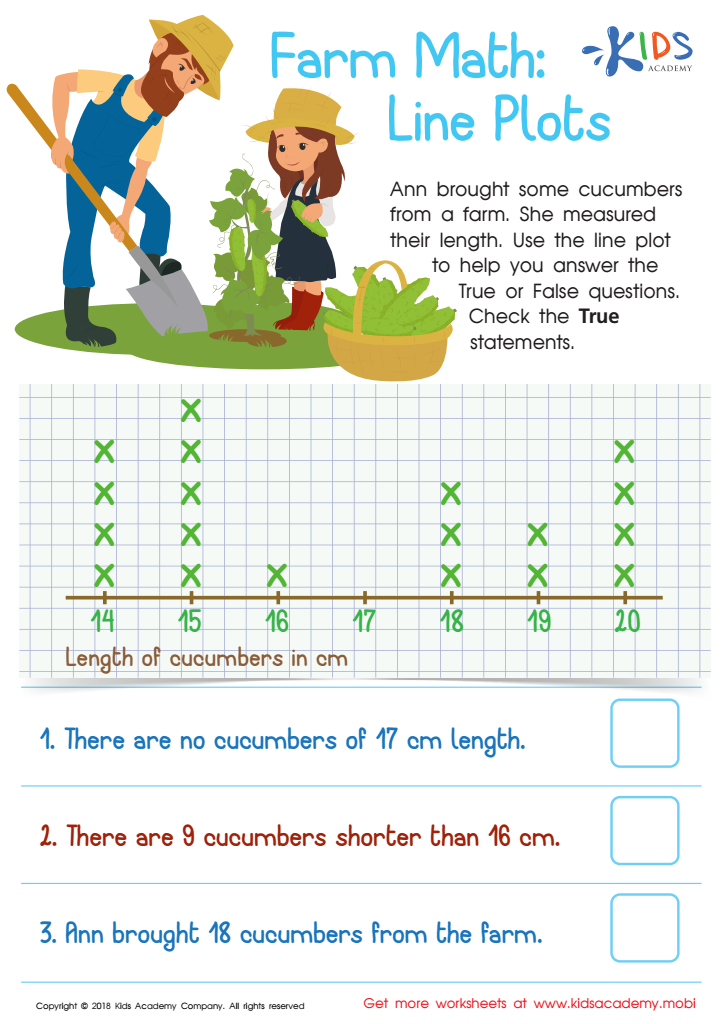
Farm Math: Line Plots Worksheet


Data interpretation is important for 7-year-olds, and it matters for parents and teachers for several reasons. First, it helps kids understand the world around them. For example, when they learn how to read graphs or charts, they can better understand trends, like which fruits are the most popular in their class or how many hours kids spend playing outside each week. This skill encourages critical thinking and helps kids to recognize patterns.
Second, data interpretation builds strong math skills. When 7-year-olds work with numbers, it boosts their confidence in math, making those subjects less intimidating. Understanding data can also help them with future school projects, turning facts and figures into understandable information.
Third, these skills promote decision-making. Kids learn to collect information, think about it, and make informed choices, like what games to play or what snacks to choose.
Finally, in our technology-driven world, being data literate is becoming increasingly important. By teaching children to interpret data now, we prepare them for the future, where these skills will be essential for success in school and beyond. In short, helping children understand data is a fun and meaningful way to support their growth, both academically and personally.