Normal Graphs Worksheets for Ages 4-9
4 filtered results
-
From - To
Our "Normal Graphs Worksheets for Ages 4-9" are the perfect resource to introduce young learners to graphing concepts. Tailored specifically for kids aged 4-9, these engaging worksheets help children understand and interpret various types of graphs, such as bar graphs and pictographs. Through fun activities, colorful illustrations, and simple exercises, kids can enhance their analytical skills and develop a foundational understanding of data representation. Ideal for both classroom and home use, these worksheets provide a comprehensive learning experience, encouraging curiosity and boosting confidence in math. Download now to make math learning enjoyable and effective!

Graph: Baby Animals Worksheet
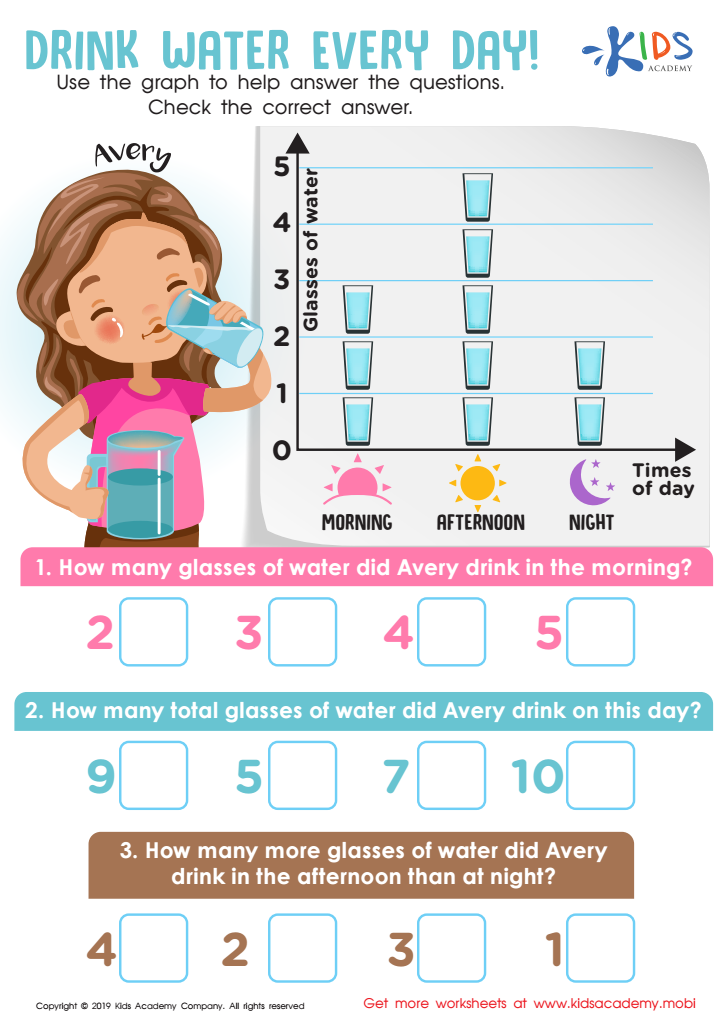
Drink Water Every Day! Worksheet
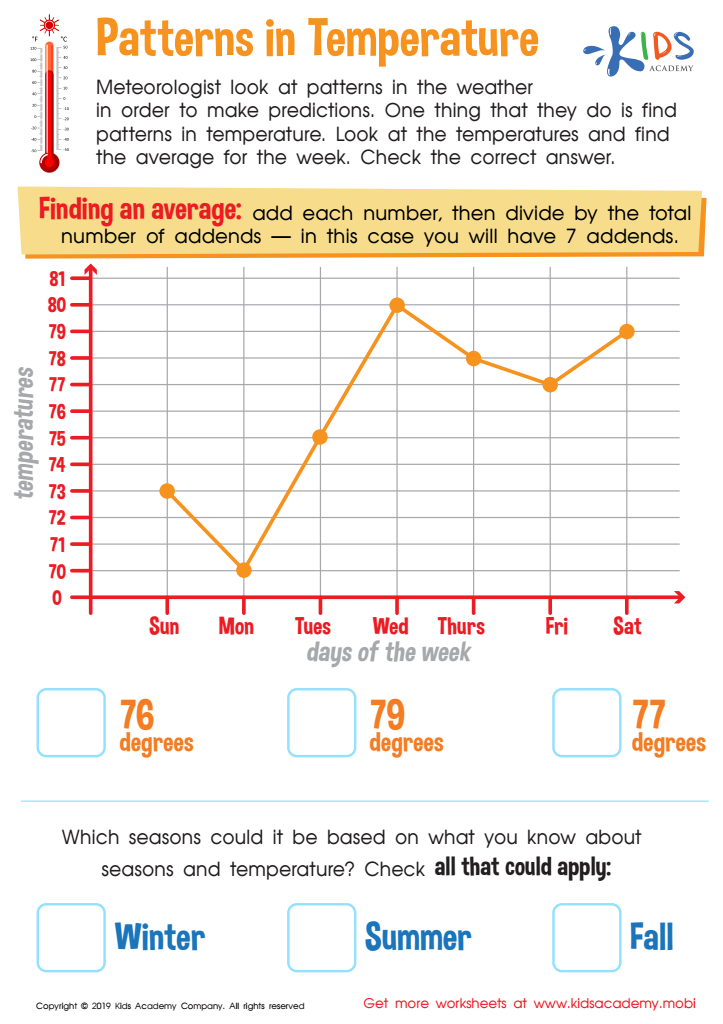
Patterns in Temperature Worksheet
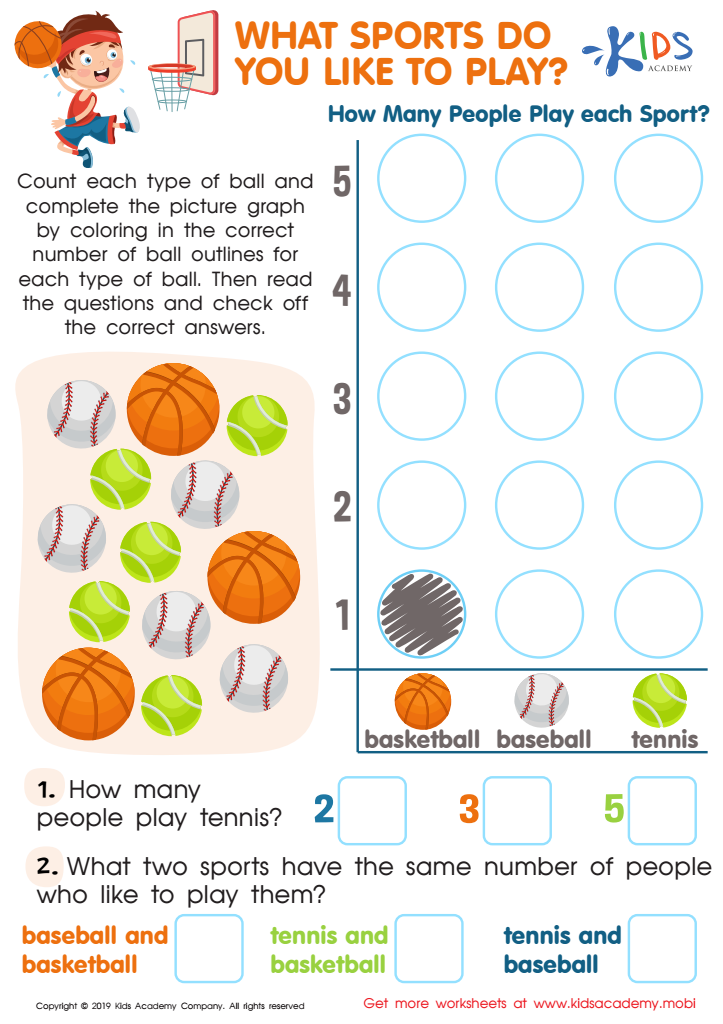
What Sports Do You Like to Play Worksheet


Understanding normal growth and development curves, often displayed as normal graphs, for ages 4-9 is crucial for both parents and teachers as these graphs offer valuable insights into a child’s progress. First, these graphs provide a visual representation of typical developmental milestones, including physical growth, cognitive abilities, and social behaviors. By knowing what is standard for a certain age group, parents and teachers can identify if a child is thriving or if there may be areas needing attention.
For teachers, these benchmarks can inform instructional strategies and classroom management, ensuring activities are age-appropriate and cater to the diverse needs of the students. It helps in creating an inclusive learning environment where every child’s development is supported.
Parents can use these reference charts to monitor their child’s development and seek timely interventions if necessary. These tools can guide discussions with pediatricians, teachers, and specialists, enabling collaborative decisions that support the child’s well-being.
Furthermore, understanding these norms helps reduce unnecessary worries. Growth atypicalities, like being slightly outside the average in height or weight, can often be perfectly normal, but early detection of potential issues is key in addressing them effectively. Thus, familiarity with these graphs empowers parents and teachers to support holistic child development confidently and proactively.