Normal Graphs Worksheets for Ages 6-8
4 filtered results
-
From - To
Welcome to our engaging collection of Normal Graphs Worksheets designed for children ages 6-8! These interactive resources introduce young learners to the fundamentals of graphing and data representation in a fun and accessible way. Each worksheet promotes critical thinking and enhances mathematical skills through a variety of activities such as plotting points, reading graphs, and understanding basic data concepts. Perfect for classroom use or at-home learning, our worksheets support the development of essential analytical skills. Fire up your child's curiosity and ensure they master graph concepts with our thoughtfully crafted worksheets, fostering confidence in their math abilities!

Graph: Baby Animals Worksheet
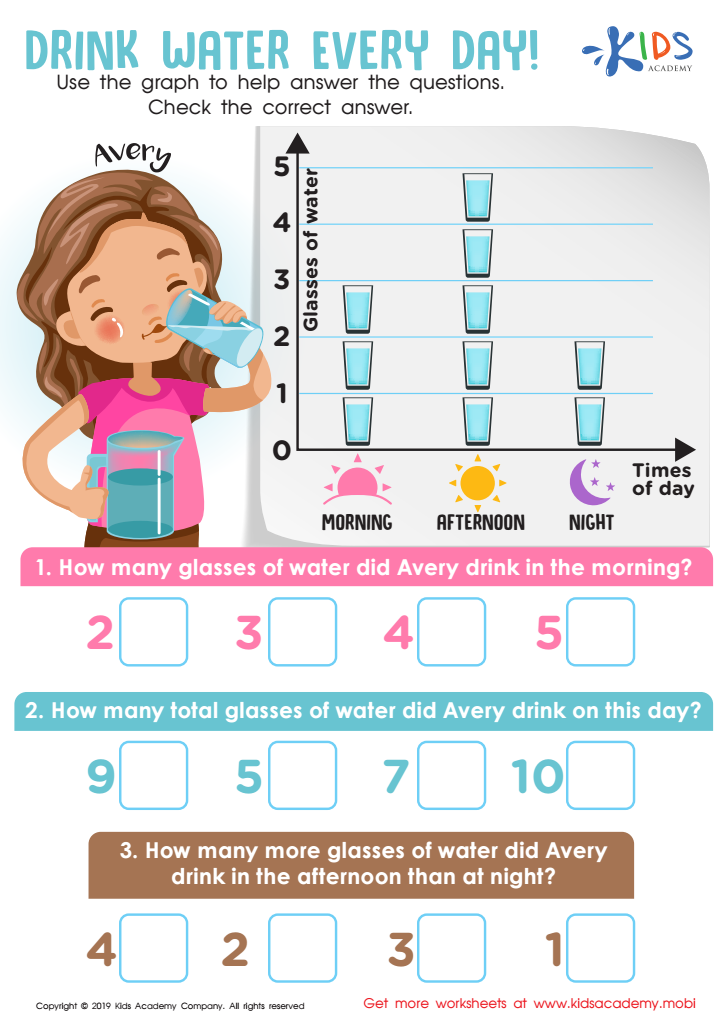
Drink Water Every Day! Worksheet
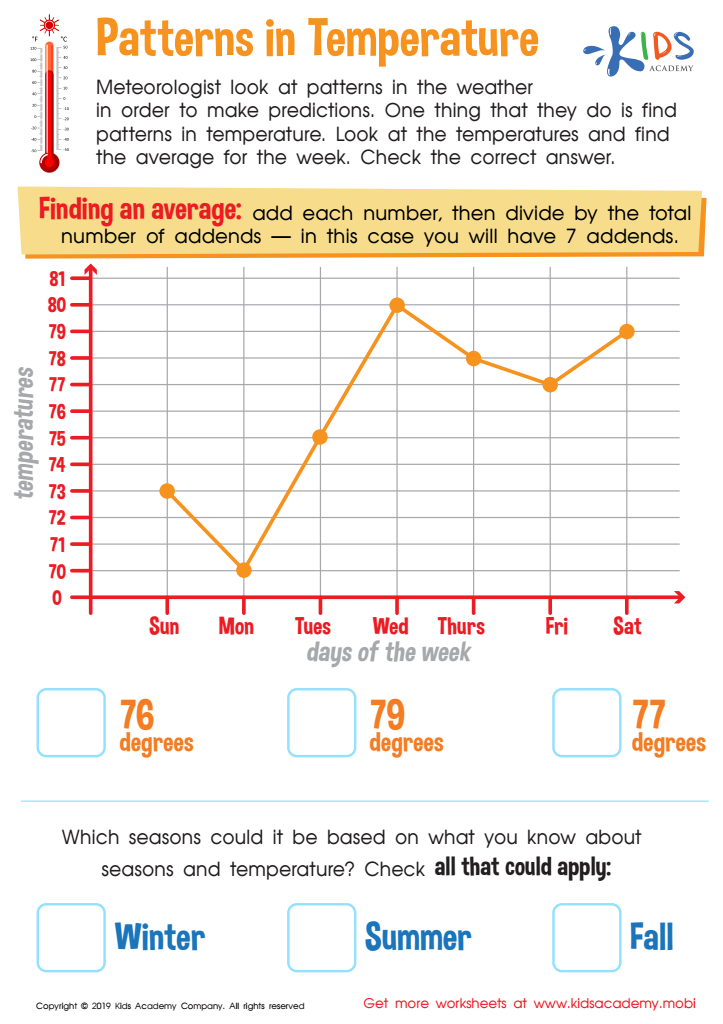
Patterns in Temperature Worksheet
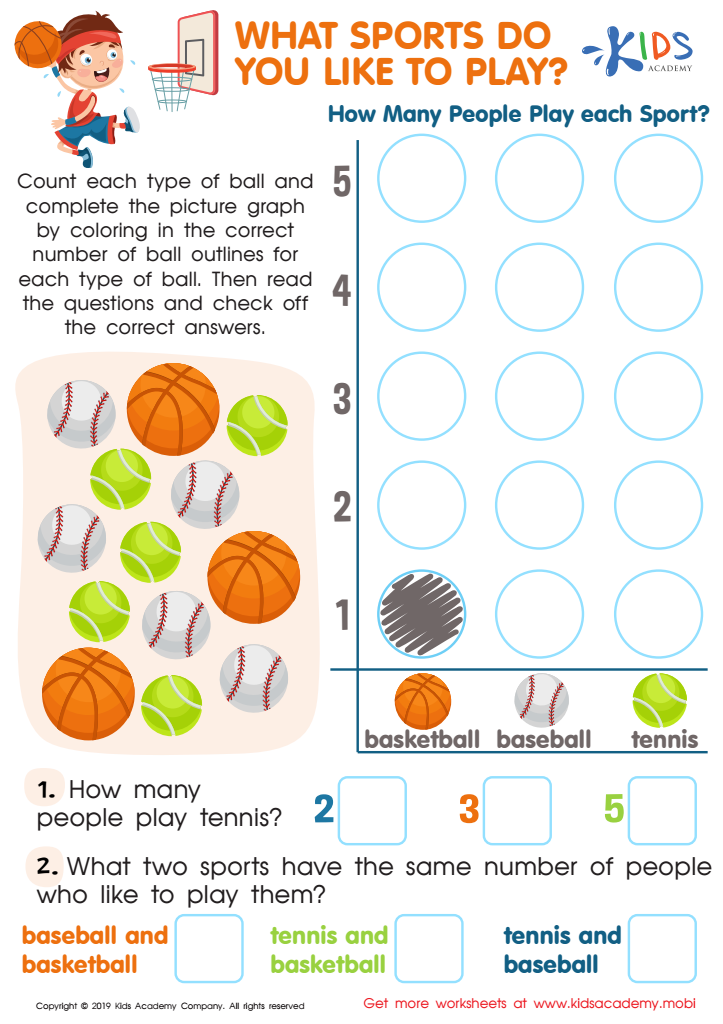
What Sports Do You Like to Play Worksheet


Normal graphs, or the concept of normal distribution and graphing in early education, play an essential role in developing numerical literacy in children aged 6-8. At this formative stage, children begin to understand patterns, measurement, and data representation—key foundational skills in math.
Teachers and parents should care about normal graphs because they promote analytical thinking. Engaging children with graphs helps them visualize data, allowing crucial comprehension of large amounts of information at a glance. Learning to create and interpret normal graphs also fosters critical thinking skills, as children analyze numbers and determine how to categorize or depict their findings.
Additionally, introducing these concepts progressively helps children build logic and reasoning abilities. It creates an appreciation for more advanced mathematical concepts they'll encounter later, such as statistics and probability.
Furthermore, incorporating normal graphs into playful activities can deepen a child's enthusiasm for learning. It makes abstract math concepts tangible and relevant to their daily lives, reinforcing their understanding.
In summary, understanding normal graphs equips children with essential skills for academic success, nurtures a lifelong love of math, and prepares them for future learning in an increasingly data-driven world.