Normal Graphs Worksheets for Ages 6-9
4 filtered results
-
From - To
Welcome to our Normal Graphs Worksheets for ages 6-9! Designed specifically for young learners, these engaging worksheets introduce foundational graphing concepts through fun and interactive activities. Children will explore essential skills like reading and interpreting normal graphs, plotting points, and understanding data representation. Perfect for classroom use or at-home learning, our resources promote critical thinking and enhance numeracy skills. Each worksheet is tailored to capture the interest of young minds, fostering a love for mathematics. Empower your child’s educational journey with our user-friendly and visually appealing normal graphs worksheets that make learning enjoyable and effective!

Graph: Baby Animals Worksheet
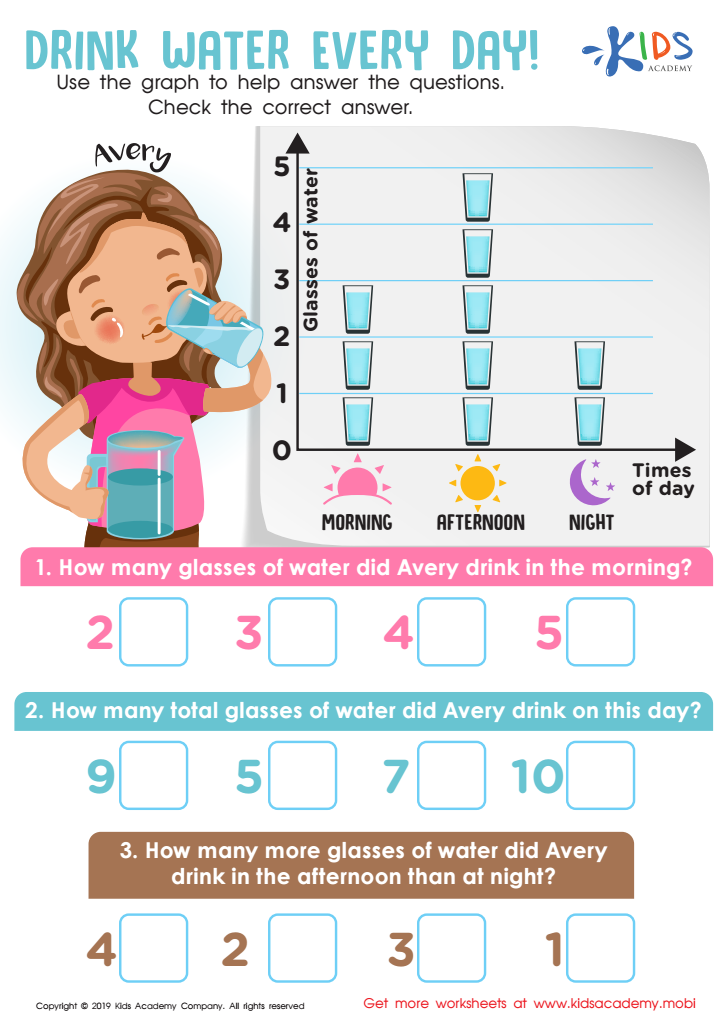
Drink Water Every Day! Worksheet
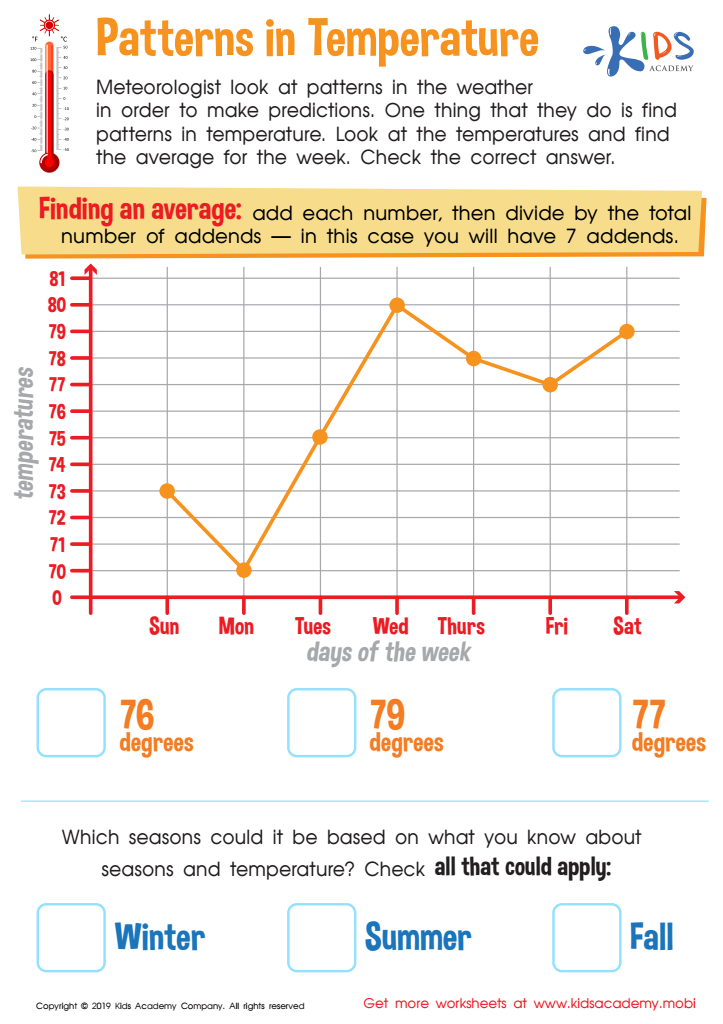
Patterns in Temperature Worksheet
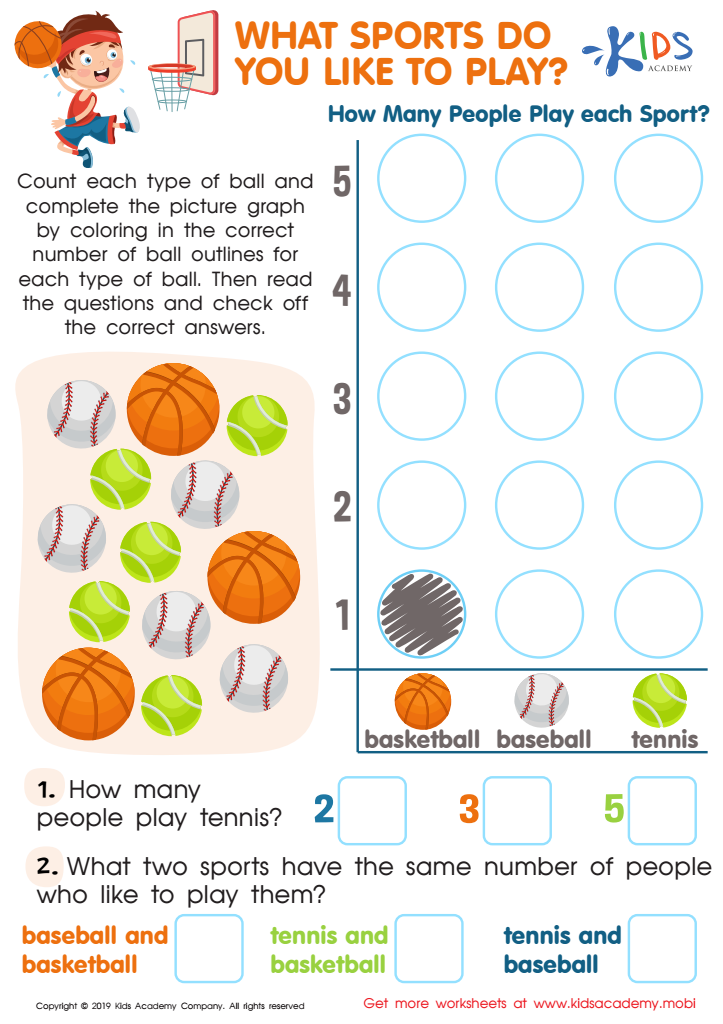
What Sports Do You Like to Play Worksheet


Normal graphs, or frequency distribution graphs, play a crucial role in helping children aged 6 to 9 develop foundational mathematical skills. Understanding these graphs aids in enhancing data literacy, encouraging children to analyze and interpret everyday information, such as sports statistics or survey results.
For parents and teachers, fostering an environment where children can visualize data through normal graphs promotes critical thinking. Children learn how to organize and classify data effectively, which supports their problem-solving abilities. Additionally, by engaging with these visual tools, kids become acquainted with concepts like averages and variability, laying the groundwork for more complex statistical understanding in later grades.
Moreover, normal graphs encourage collaboration during classroom activities or family discussions. Analyzing data in groups enhances social skills and allows for diverse viewpoints, fostering an inclusive learning atmosphere. For teachers, utilizing normal graphs can make lessons more dynamic and approachable, ensuring that mathematical concepts resonate with young learners. Parents can further support this learning at home by incorporating everyday examples, making math enjoyable and relevant. Ultimately, investing time in understanding normal graphs enriches children’s educational experiences, equipping them with essential skills for academic success and informed decision-making.