Normal Graphs Worksheets for Ages 5-9
4 filtered results
-
From - To
Explore our "Normal Graphs Worksheets for Ages 5-9," designed to introduce young learners to the fundamentals of graphing in an engaging and interactive way. These worksheets offer a variety of activities that help children understand the concept ofGraphs, including labeling, plotting, and interpreting data in a fun format suited for early education. With colorful visuals and age-appropriate challenges, students can develop critical thinking and analytical skills while enjoying hands-on learning. Perfect for classroom use or at-home practice, these worksheets support foundational math skills that will set your child up for success. Download and start exploring the world of graphs today!

Graph: Baby Animals Worksheet
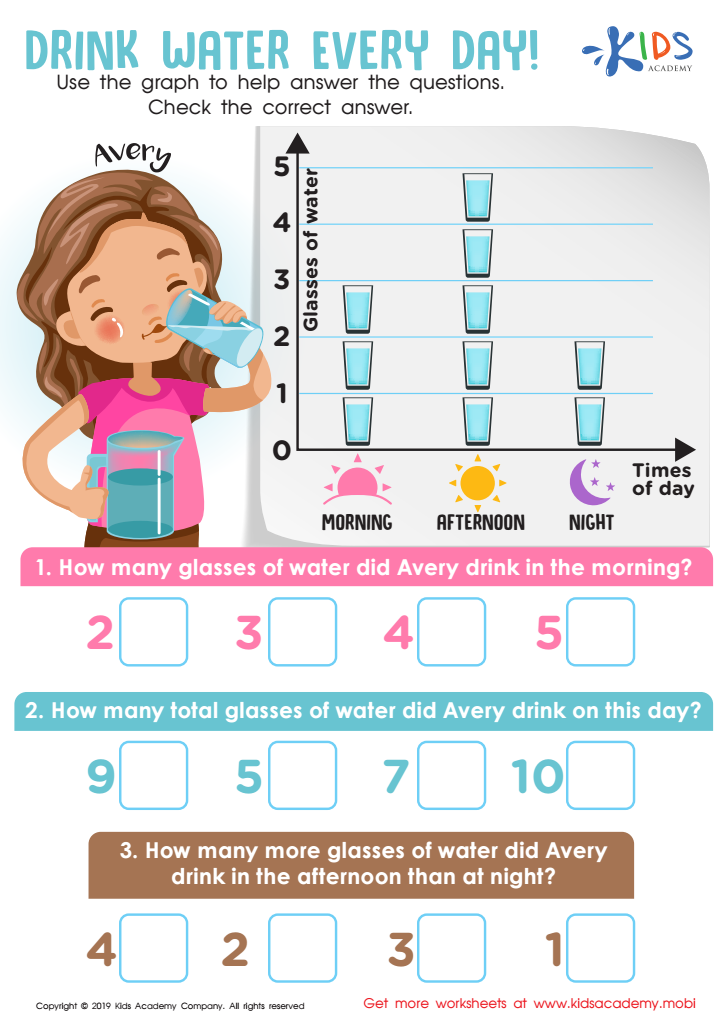
Drink Water Every Day! Worksheet
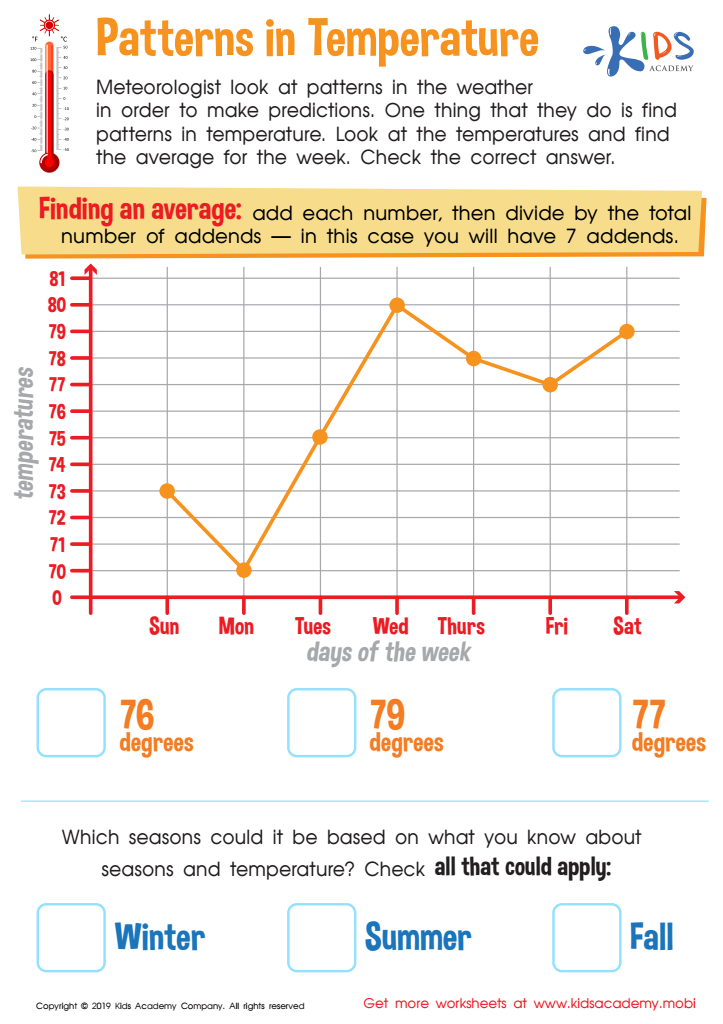
Patterns in Temperature Worksheet
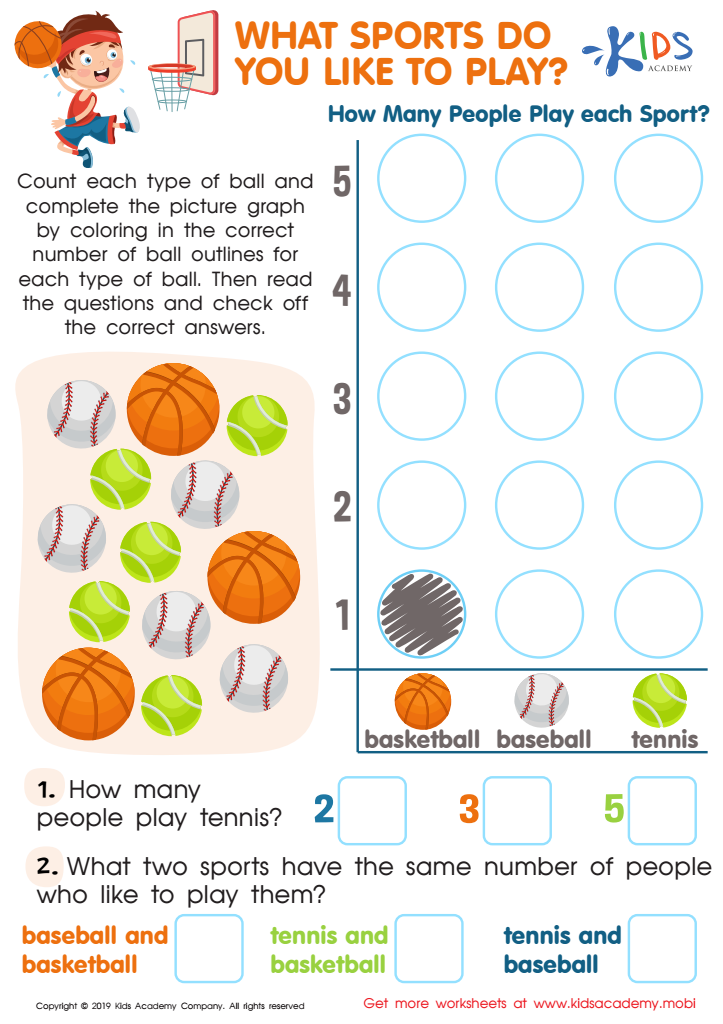
What Sports Do You Like to Play Worksheet


Normal graphs, or visual representations of data, are crucial tools for children ages 5-9 in developing essential skills. Engaging with graphs can enhance comprehension of mathematical concepts, improve critical thinking, and foster data literacy early on. For parents and teachers, incorporating normal graphs into learning ensures that children are not merely memorizing numbers but are also understanding the relationships between them.
As children progress through these formative years, they begin to explore basic concepts of counting, measuring, and organizing information. Normal graphs, such as bar charts and pie charts, provide a colorful, interactive way to illustrate relationships between different data sets, making abstract concepts more tangible. Working with graphs encourages students to analyze information, draw conclusions, and communicate their findings.
Additionally, exposure to graphing promotes collaboration and discussion, as children can share their interpretations and explore different viewpoints. Given the data-driven world we live in, fostering early familiarity with data displays prepares children for future academic success and informed decision-making. Ultimately, parents and teachers play a pivotal role in integrating these tools into the curriculum to help young learners become proficient in understanding and utilizing data effectively.