Normal Graphs Worksheets for Ages 6-9
4 filtered results
Difficulty Level
Grade
Age
-
From - To
Subject
Activity
Standards
Introduce young learners to the world of data representation with our Normal Graphs Worksheets for ages 6-9. At Kids Academy, our engaging worksheets provide a fun and educational way for children to master the basics of graphing. These activities are designed to enhance skills in reading, interpreting, and creating various types of graphs, such as bar graphs and pictograms. Perfect for both classroom and home use, our worksheets make learning interactive and enjoyable. Help your child build a strong foundation in math with visually appealing and easy-to-understand exercises, paving the way for future success in data analysis.
Favorites
With answer key
Interactive
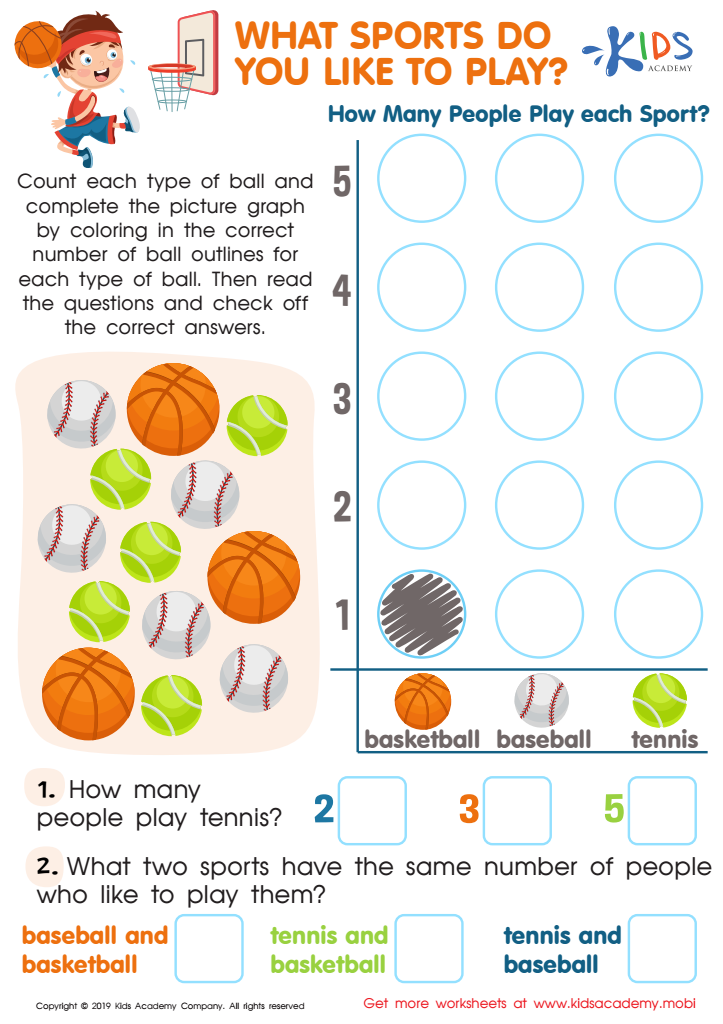
What Sports Do You Like to Play Worksheet
Encourage your kids to complete this fun sports-themed math worksheet! Count each type of ball then help them complete the picture graph. It's a great way to make math a fun, tear-free activity. Download our printable PDF to get started!
What Sports Do You Like to Play Worksheet
Worksheet
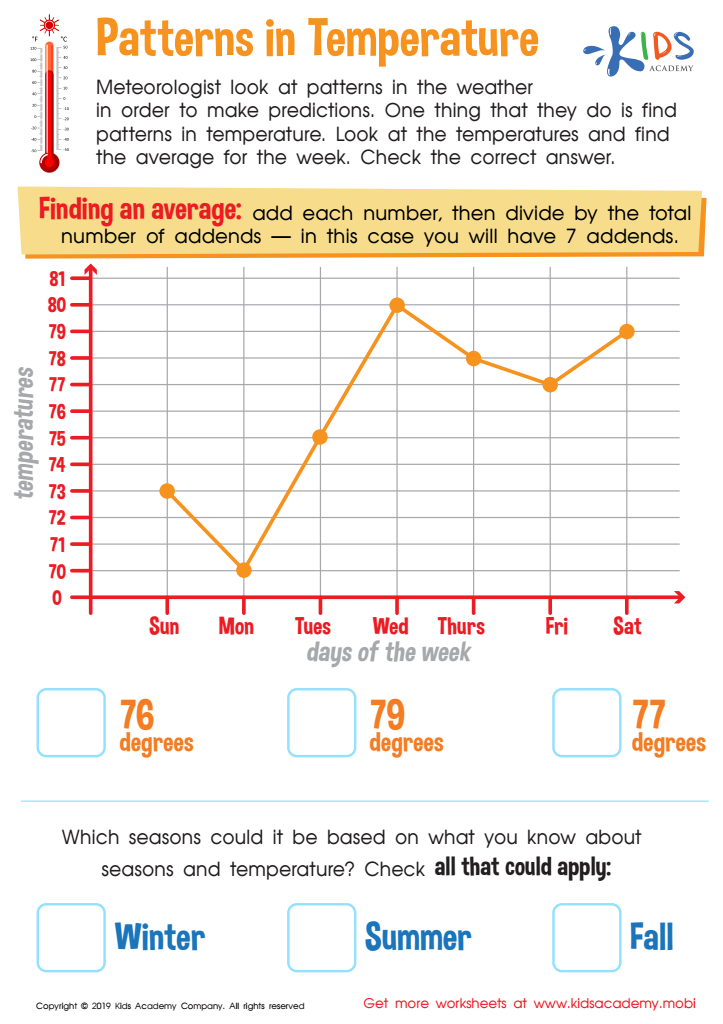
Patterns in Temperature Worksheet
Kids need to learn how to read and interpret data from graphs and charts. This free worksheet on temperature patterns helps them to do just that. They'll practice finding averages and answer questions in multiple-choice format. Plus, it provides a great learning experience!
Patterns in Temperature Worksheet
Worksheet
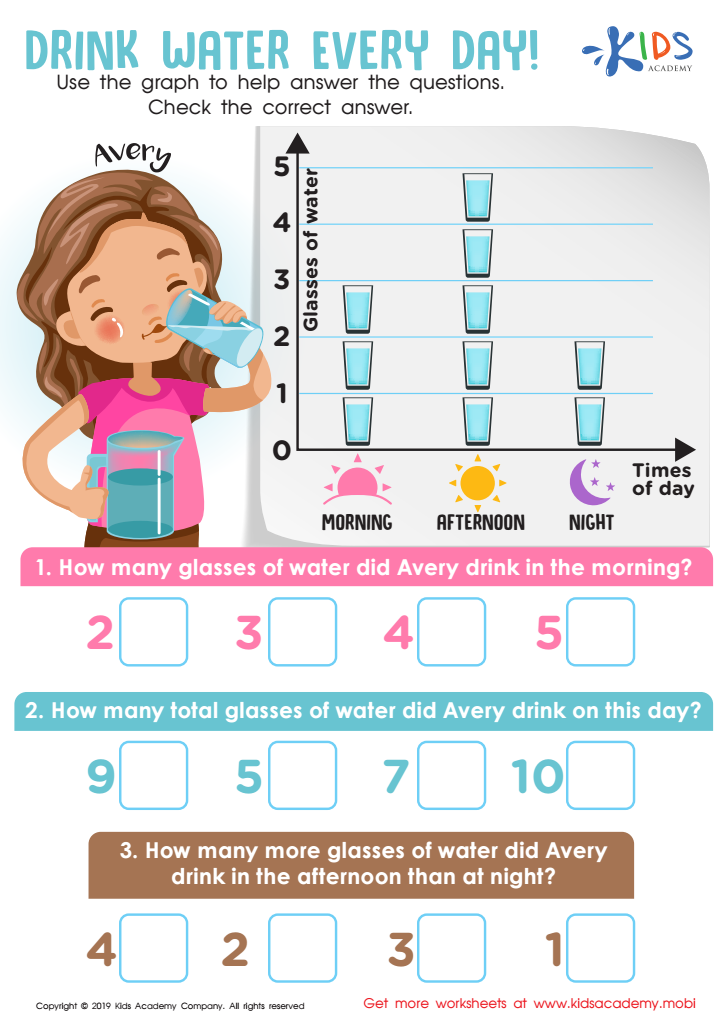
Drink Water Every Day! Worksheet
Water is essential for life. Without it, all living things would die eventually. Drinking it regularly is key to our survival. Help your kids understand the importance of water by looking at the graph in the worksheet together, and help them answer the questions it contains.
Drink Water Every Day! Worksheet
Worksheet

Graph: Baby Animals Worksheet
Graphs are essential for learning in math, science and ELA. This worksheet featuring baby animals is a fun way to practice reading graphs. Look at the graph and answer the questions below it. Check the boxes for the right answers based on the data.
Graph: Baby Animals Worksheet
Worksheet
Join Kids Academy for Free
Who is primarily going to use this learning content?


Normal graphs, also known as bell curves or normal distribution curves, represent an essential concept in understanding how a set of data points tend to be distributed in a typical population. For children aged 6-9, understanding and monitoring their development is crucial for identifying any potential concerns early. Normal graphs can help parents and teachers visualize where a child's progress falls relative to their peers.
When tracking academic performance, cognitive development, or even physical growth, normal graphs provide a clear picture. They show the average range and highlight any statistical outliers, indicating if a child is significantly ahead or behind. This information can be used to tailor individual learning plans to better suit a child's specific needs. For instance, a child falling consistently below the median might benefit from extra support, whereas a child above may need more challenging materials.
Additionally, normal graphs help foster a more personalized, understanding approach to child development. Recognizing that each child progresses at their own pace allows for appropriate adjustments to be made in teaching strategies. It alleviates undue stress borne from comparisons and sets realistic expectations among parents and educators, encouraging a more supportive and nurturing learning environment.