Graphs Worksheets for Ages 6-9 - Page 2
27 filtered results
-
From - To
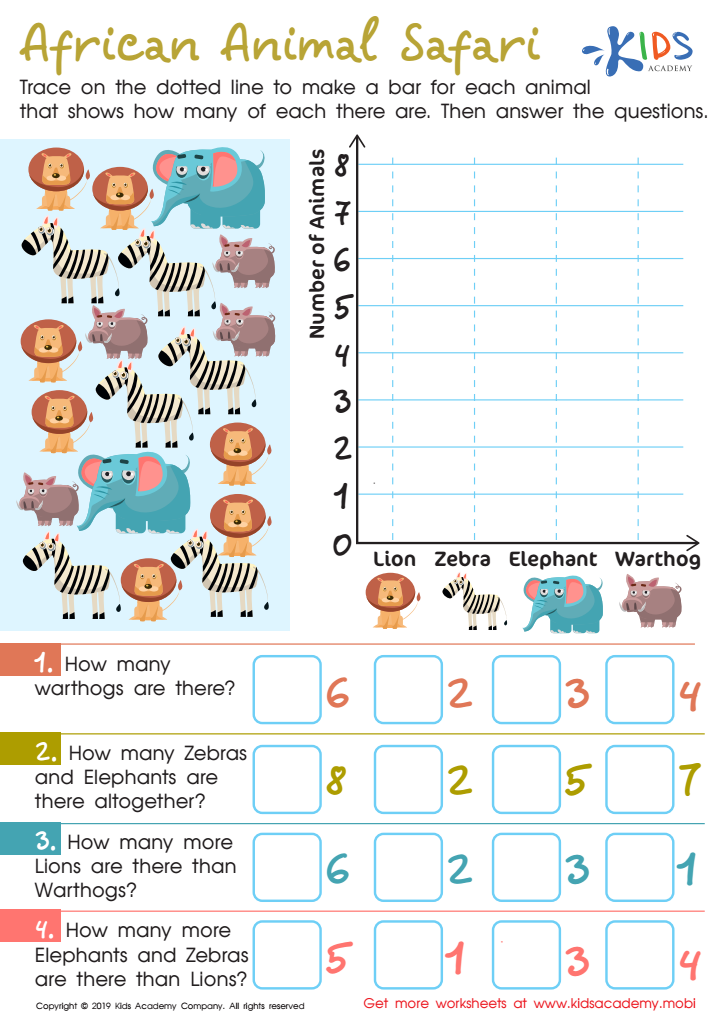
African Animal Safari Worksheet

Leaf Measure Line Plot Worksheet

Football Math Worksheet


Graphs are a vital tool for teaching young children aged 6-9 about data representation and interpretation, which helps develop critical thinking skills. Understanding graphs fosters an early appreciation for mathematics and science, showing children how to organize information visually. This age group is at a stage where they can begin recognizing patterns, making comparisons, and drawing conclusions based on data.
When parents and teachers introduce graphs, they create engaging learning experiences that relate to children’s everyday lives, such as pizza slices, toy collections, or favorite colors. This engagement promotes numerical literacy and facilitates discussions about data interpretation, such as identifying the highest or lowest values in a chart.
Moreover, comprehension of graphs lays the groundwork for more complex mathematical concepts, instilling confidence and encouraging analytical problem-solving skills. These competencies are essential for academic success and informed decision-making later in life.
Overall, fostering graph literacy in young children nurtures their curiosity, enables self-expression through data interpretation, and equips them with the skills needed to navigate a data-driven world. By prioritizing graph education, parents and teachers can significantly support children's cognitive development and understanding of how to communicate and analyze information effectively.


