Normal Graphs Worksheets for Ages 7-8
4 filtered results
Difficulty Level
Grade
Age
-
From - To
Subject
Activity
Standards
Introducing our captivating "Normal Graphs for Ages 7-8" worksheets – an engaging collection designed to introduce young learners to the world of graph comprehension and data presentation. Tailored specifically for children aged 7 to 8 years, these worksheets are packed with colorful and intriguing activities that will foster an interest in mathematics through the exploration of normal graphs. From understanding simple bar charts to pie graphs, each page is crafted to encourage critical thinking, enhance numerical literacy, and develop analytical skills in a fun and interactive way. Dive into our Normal Graphs series and watch your child delight in the magic of mathematics!
Favorites
With answer key
Interactive
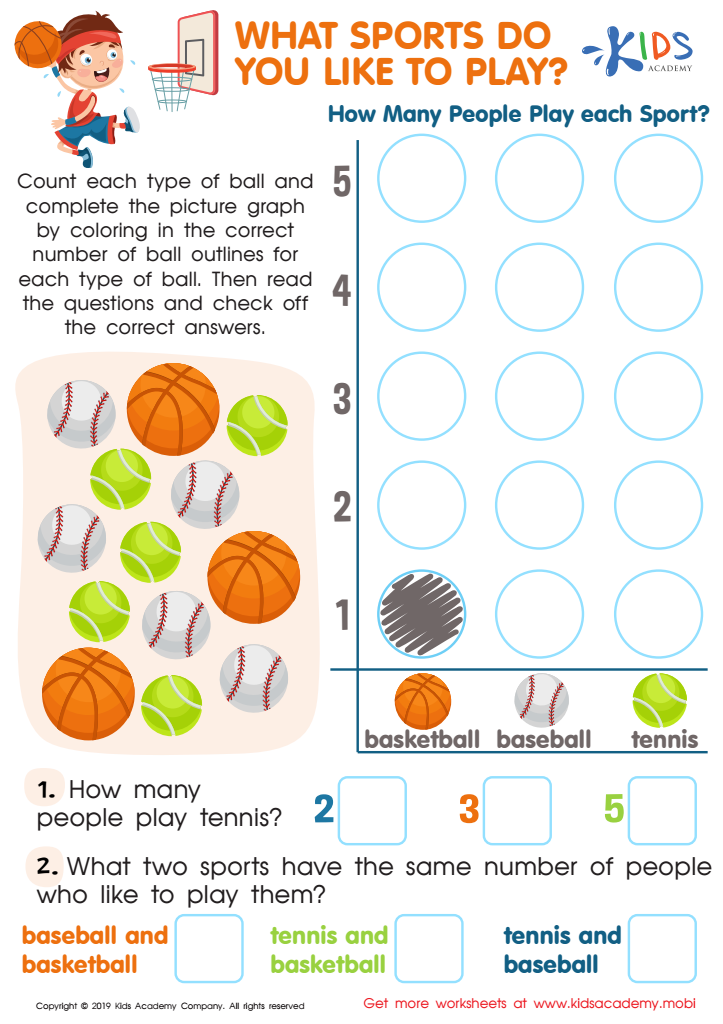
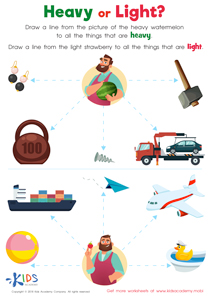
What Sports Do You Like to Play Worksheet
Encourage your kids to complete this fun sports-themed math worksheet! Count each type of ball then help them complete the picture graph. It's a great way to make math a fun, tear-free activity. Download our printable PDF to get started!
What Sports Do You Like to Play Worksheet
Worksheet
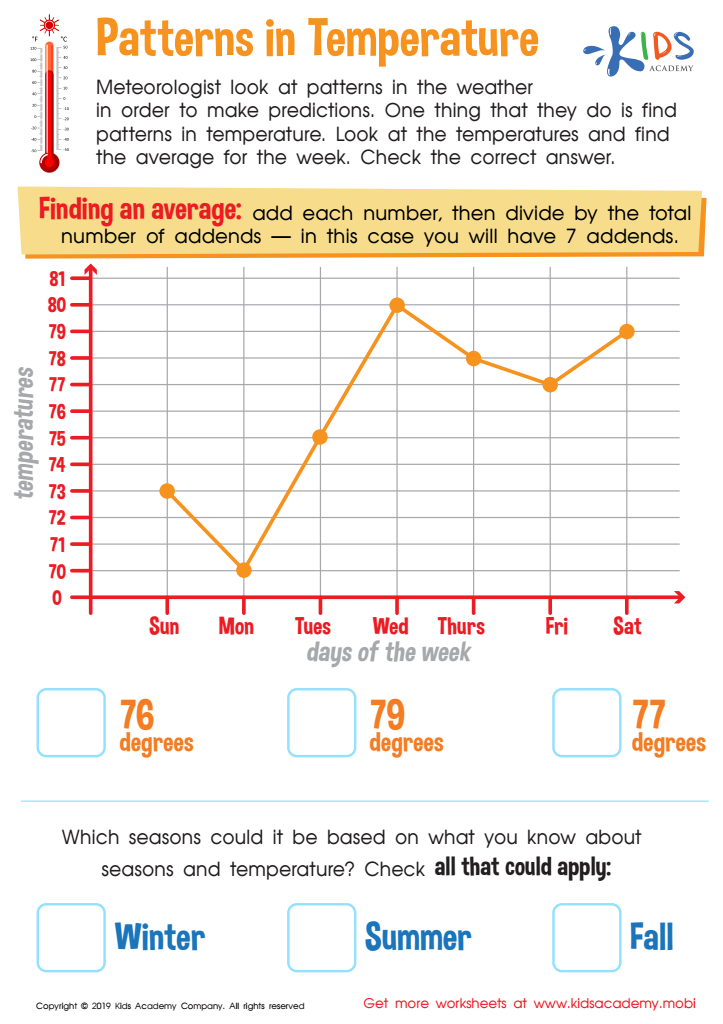
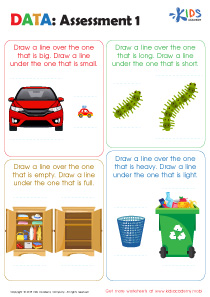
Patterns in Temperature Worksheet
Kids need to learn how to read and interpret data from graphs and charts. This free worksheet on temperature patterns helps them to do just that. They'll practice finding averages and answer questions in multiple-choice format. Plus, it provides a great learning experience!
Patterns in Temperature Worksheet
Worksheet
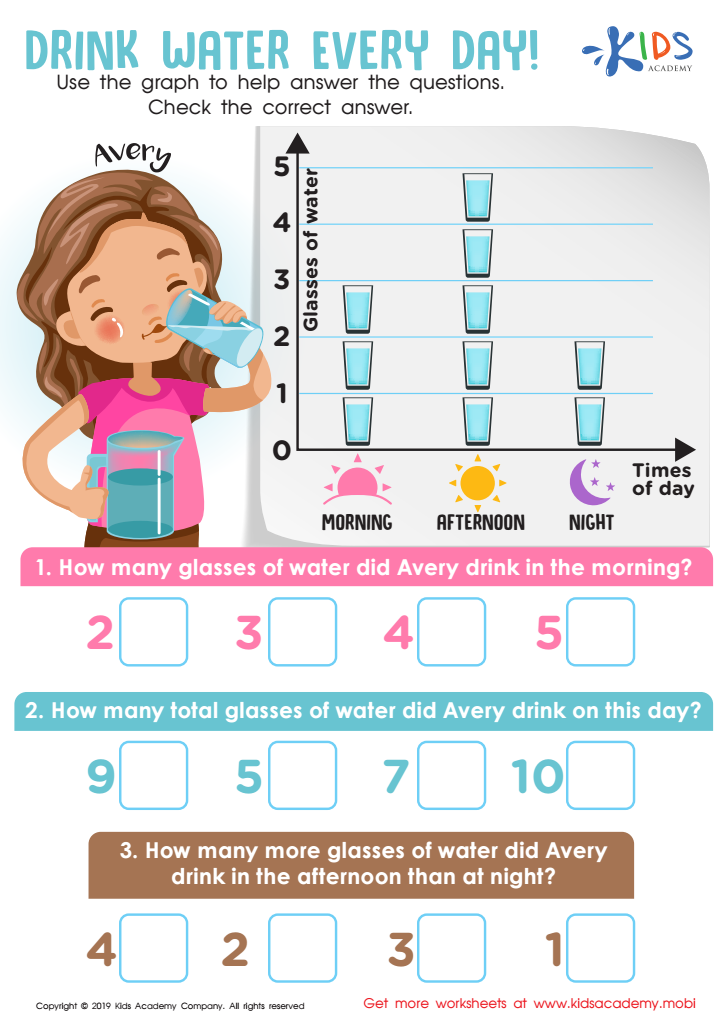
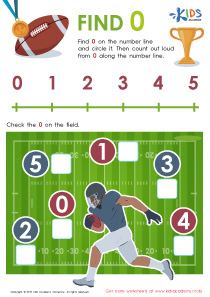
Drink Water Every Day! Worksheet
Water is essential for life. Without it, all living things would die eventually. Drinking it regularly is key to our survival. Help your kids understand the importance of water by looking at the graph in the worksheet together, and help them answer the questions it contains.
Drink Water Every Day! Worksheet
Worksheet

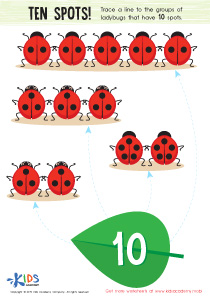
Graph: Baby Animals Worksheet
Graphs are essential for learning in math, science and ELA. This worksheet featuring baby animals is a fun way to practice reading graphs. Look at the graph and answer the questions below it. Check the boxes for the right answers based on the data.
Graph: Baby Animals Worksheet
Worksheet
Join Kids Academy for Free
Who is primarily going to use this learning content?


Normal Graphs for Ages 7-8 serve as an invaluable learning tool, providing children with a foundation in understanding graphical representations of data—a skill that is increasingly crucial in our data-driven world. These worksheets are specifically designed to cater to the cognitive and comprehension levels of 7 to 8-year-old students, ensuring that the complexity of the graphs matches their learning stage. This alignment ensures that children are not overwhelmed but are instead introduced to the concept of graphs in an engaging and accessible manner.
Engaging with Normal Graphs at ages 7-8 helps students to visualize mathematical concepts, making abstract ideas more concrete. Through these worksheets, children learn to interpret simple data sets, recognize patterns, and even start making predictions based on the information presented in the graphs. This early exposure to data interpretation and analysis lays a strong foundation for more advanced mathematical and statistical concepts they will encounter in the future.
Moreover, incorporating Normal Graphs into the curriculum for Ages 7-8 encourages critical thinking and problem-solving skills. Students learn not just to consume information but to question and analyze it. This kind of analytical thinking is essential across all areas of study and in everyday life, making Normal Graphs worksheets an indispensable educational resource.