Understanding bar graphs Extra Challenge Grade 3 Math Worksheets
3 filtered results
Difficulty Level
Grade
Age
-
From - To
Subject
Activity
Standards
Favorites
With answer key
Interactive
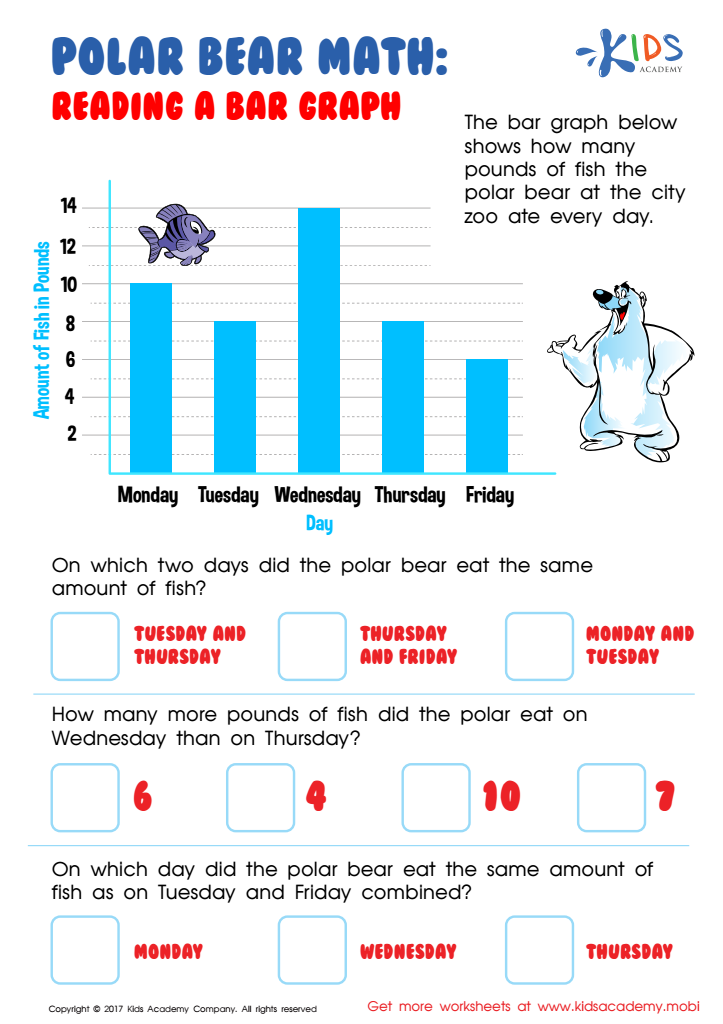

Reading Bar Graph Worksheet
Take your child north to practice data reading with a polar bear friend! This worksheet challenges 3rd graders to interpret data on a graph and solve related math problems.
Reading Bar Graph Worksheet
Worksheet
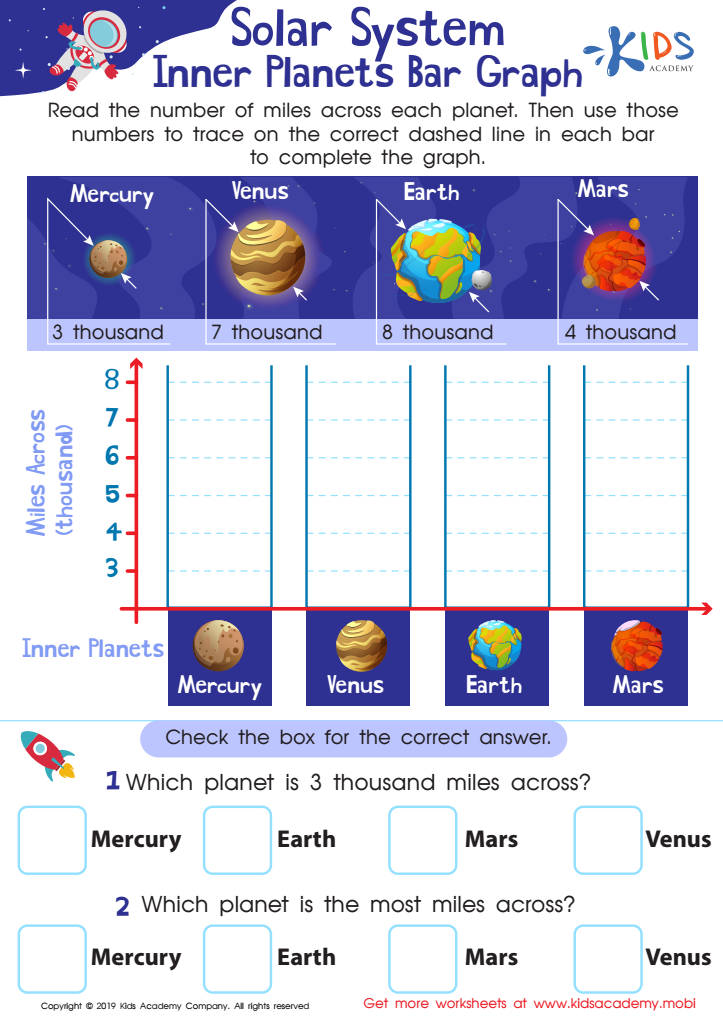

Planets Bar Graph Worksheet
With this fun, educational worksheet, kids can learn about bar graphs and the solar system simultaneously. Introduce them to the concept by reading out the number of miles for each planet, then help them trace the dashed lines in each bar to complete the graph.
Planets Bar Graph Worksheet
Worksheet
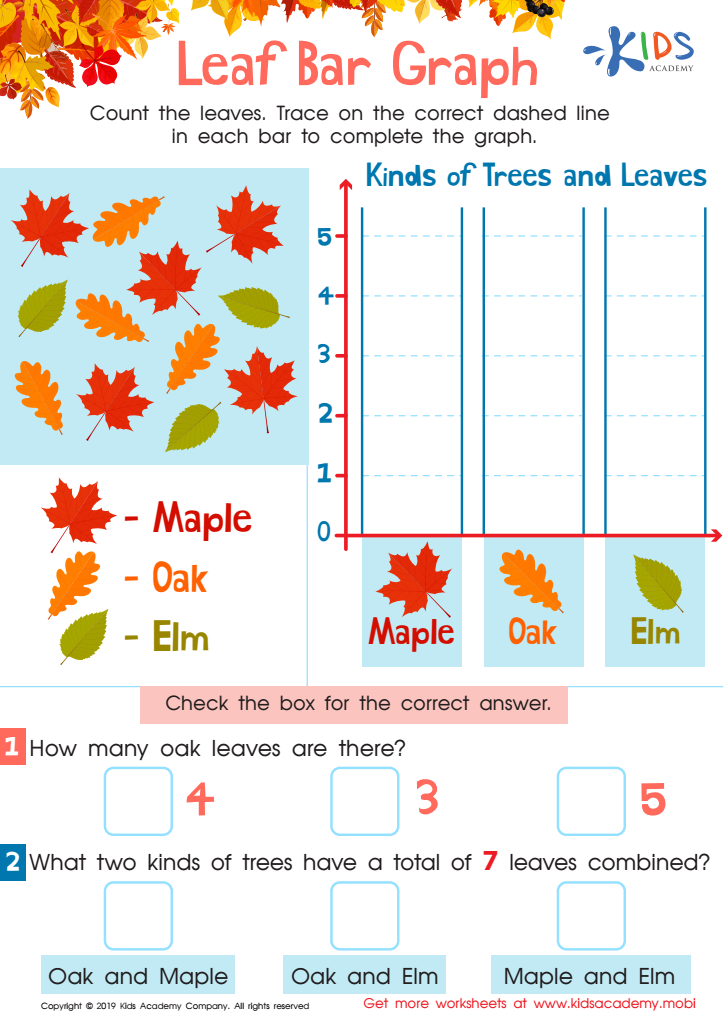

Leaf Bar Graph Worksheet
You can help your kids make learning easier and more enjoyable. While their teachers provide lessons and homework, you can take their education further. This worksheet can assist them in mastering bar charts. Count the leaves, then trace the correct line for each bar to complete the graph.
Leaf Bar Graph Worksheet
Worksheet
 Assign to the classroom


