Interpreting bar graphs Worksheets for Kids
2 filtered results
-
From - To
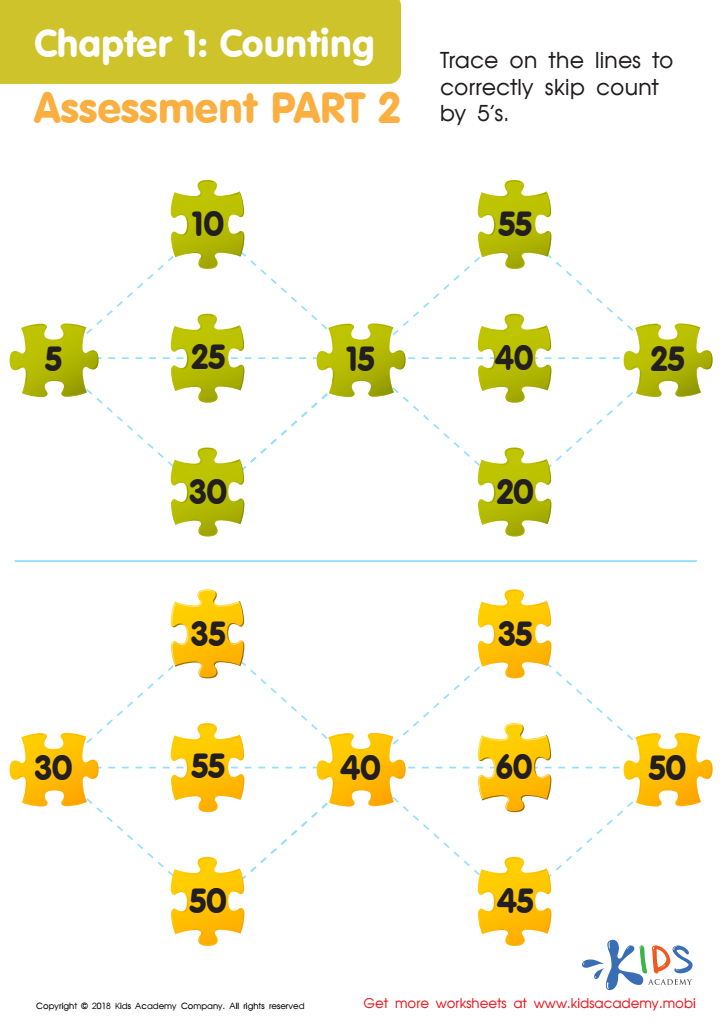
Counting: Assessment 2 Worksheet
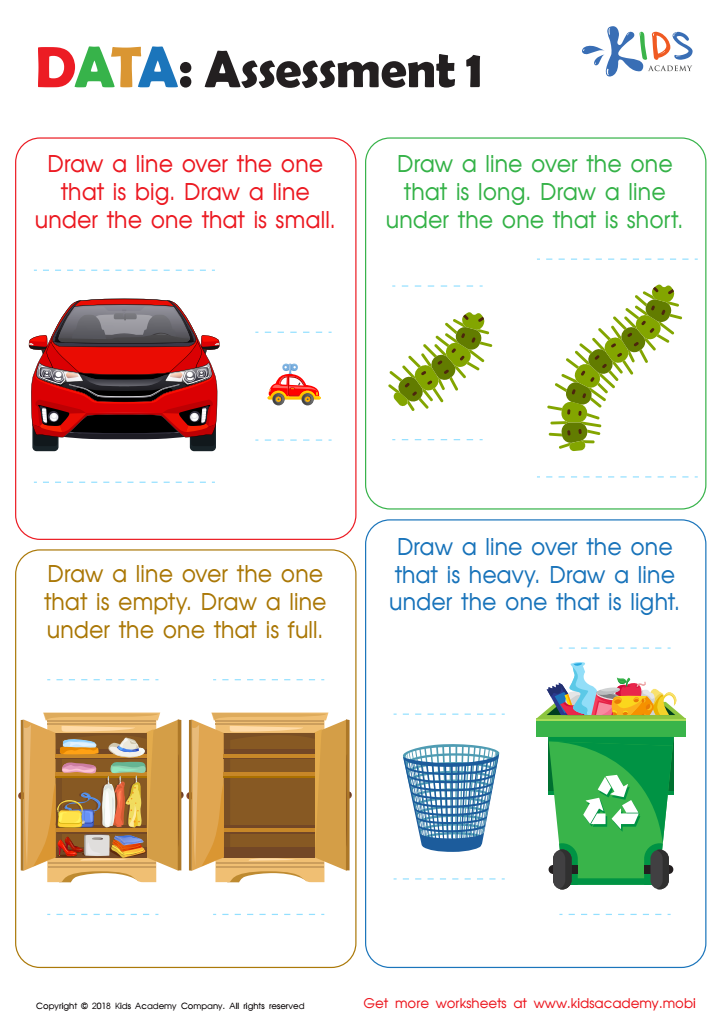
Data: Assessment 1 Worksheet
Question/Answer
How to test a Grade 1 student’s Interpreting bar graphs skills?
To test a Grade 1 student's ability to interpret bar graphs, provide a simple bar graph with familiar items or concepts (e. g. , favorite fruits, pets in the class).
How to train the Interpreting bar graphs skill in Grade 1 students learning about Numbers?
To train Grade 1 students in interpreting bar graphs, start by introducing simple bar graphs with familiar and engaging themes (e. g. , favorite fruits, pet types). Use physical activities like sorting objects or voting on favorite items to create a graph together.
Why is the Interpreting bar graphs skill important for Grade 1 students?
The Interpreting bar graphs skill is important for Grade 1 students as it introduces them to basic data representation and analysis. It helps them understand quantities visually, enhances their ability to compare numbers, and lays the foundation for more advanced mathematical concepts. It also fosters critical thinking by encouraging them to draw conclusions from visual information.